Leveraging B2B Outbound Prospecting To Accelerate Organic Growth (Part 2 of 3)

B2B companies with a compelling value proposition in markets including from a few thousands to a few hundred thousands prospect accounts should embrace account-based outbound prospecting to strenghten their sales process and accelerate organic revenue growth. Referencing a case study from the flexible packaging industry, this article outlines how to develop an investment case for B2B outbound prospecting to validate the significant upside potential and understand how to manage the potential downside financial risk.
In a previous article we covered the basics of outbound prospecting, its impact on market revenue consolidation, and introduced the case study we'll continue to reference in this article.
How to develop an investment case for outbound prospecting
For many leading B2B companies, building an outbound prospecting capability is a strategic investment with significant upside value and marginal downside financial risk that typically requires some external professional support and some internal changes in sales culture and budgeting practices to execute successfully.
There are few middle market B2B companies that use a methodology that manages the end-to-end process of selling as efficiently and effectively as they could. To be both efficient and effective, companies need to standardize the entire customer-facing relationship (including marketing, sales, and customer success) and achieve continuous improvements in those functions in the same way as to what has become normal in other functions like supply chain or procurement: using data driven, standardized, and intelligently automated processes.
Yet in practice, the overwhelming majority of sales teams at B2B companies in all industries still rely on a few superstar performers who deliver the lion’s share of results. These superstars leverage personal networks and intuitive judgment developed over decades in their industry to drive performance.
Superstar sales professionals are a great and valuable resource. However, the problem with this model is that superstars are expensive and hard to find and that the performance of systems relying exclusively on them is often highly variable and difficult to sustain over time.
Once ready to embrace outbound prospecting to overcome those limits, CEOs and senior sales executives will typically want to address four key questions:
- What is the nature and size of the opportunity in our industry?
- How can we setup a pilot program to validate the opportunity?
- How will we measure the pilot program success?
- What is the investment required and what kind of return can we expect?
Following is a discussion of how to address those important questions in real world situations where available information is often imperfect and the only way to develop true insights is by taking action and perform rapid iterative market testings. Depending on the size of the company and the complexity of the market, completing this work typically takes between 2 to 4 weeks.
To facilitate the discussion we'll continue to reference our case study from the flexible packaging industry that we introduced in a previous article.
The key results of the investment case we developed can be summarized as follow:
- Assuming things would go reasonably well and using conservative assumptions (i.e. the investment base case):
- During the initial 12-month pilot program, the outbound prospecting effort would generate approximately 4 new customer accounts, $800K in revenue, and a negative free cash flow of about -$534K. Additional achievements during the first year would include a new sales tech infrastructure, new content and processes, and the start of a data driven sales optimization cycle based on historical quantitative and qualitative data.
- As a result of continuos process optimizations, in Year 4 the outbound prospecting effort would generate approximately 28 new customer accounts and $6.12M in revenue from those 28 accounts. Because of the additional new customer accounts acquired in the previous 3 years (estimated to be approximately 39), however, total sales generated by the outbound prospecting program in Year 4 would be approximately $25M. The program cumulative free cash flow during the initial 4 year period would be about $5M.
- Assuming things would turn out to be more challenging than originally anticipated (i.e. investment worst case):
- As many things would not go as expected, a total of only 19 new customer accounts would be acquired during the 4 year period. However, given adjustments in the program expenses and the slow build up of revenue from new customer accounts during the 4 year period, the negative free cash flow generated during the initial two years would be compensated with some positve free cash flow during the last two years and no negative impact on the company's net financial position would materialize by the end of Year 4.
Interested readers can jump directly to the discussion of the investment case.
Understanding the nature and size of the opportunity
In most B2B industries, understanding the nature and size of the opportunity for organic growth for any given company it's not an easy task and in most cases deciding the best course of action will require heuristic estimates, educated guesses, and a test and iterate approach to develop more market intelligence, promote team learning, and validate initial assumptions.
In most B2B industries specialized market research and consulting firms provide estimates of actual and projected total market revenues by product type, product application, or some other relevant criteria. When working on high level corporate strategies this data is usually quite valuable. However, for sales executives that need to develop an operational sales growth plan the data is less useful.
Because of switching costs and other considerations associated with the introduction of a new vendor, only a portion of total market revenue is typically available for grab in any single year. However, research estimating the size of that portion is usually not available and predicting which customers will be interested in introducing a new vendor is also very hard.
In our case, for example, key questions for which we could not find robust supporting data included the following:
- How many companies in the Food & Beverage industries, in an average year, will be introducing a new flexible packaging vendor?
- What will the average number and total value of the projects shopped to new vendors be in each year?
- Why will Food & Beverage companies consider introducing a new vendor (i.e. what pain points will they try to solve with the introduction of a new vendor)?
- How many vendors on average will be invited to make a proposal for each new project and how will those vendors be selected among all those offering flexible packaging solutions?
The best that can be done at companies that don't have specific market intelligence data is to use the collective knowledge of the sales and marketing teams to develop some preliminary educated guesses. In our case, with some one-to-one interviews and group brainstorming sessions we were able to elaborate the following hypotheses:
- Between 10% to 20% of targeted CPG companies in the market would probably be interested in introducing a new vendor each year. Some we'll be proactively searching for a new solution for their known pain point, others we'll have a more reactive stance being unaware of the problem they have or that a solution exist for their known problem.
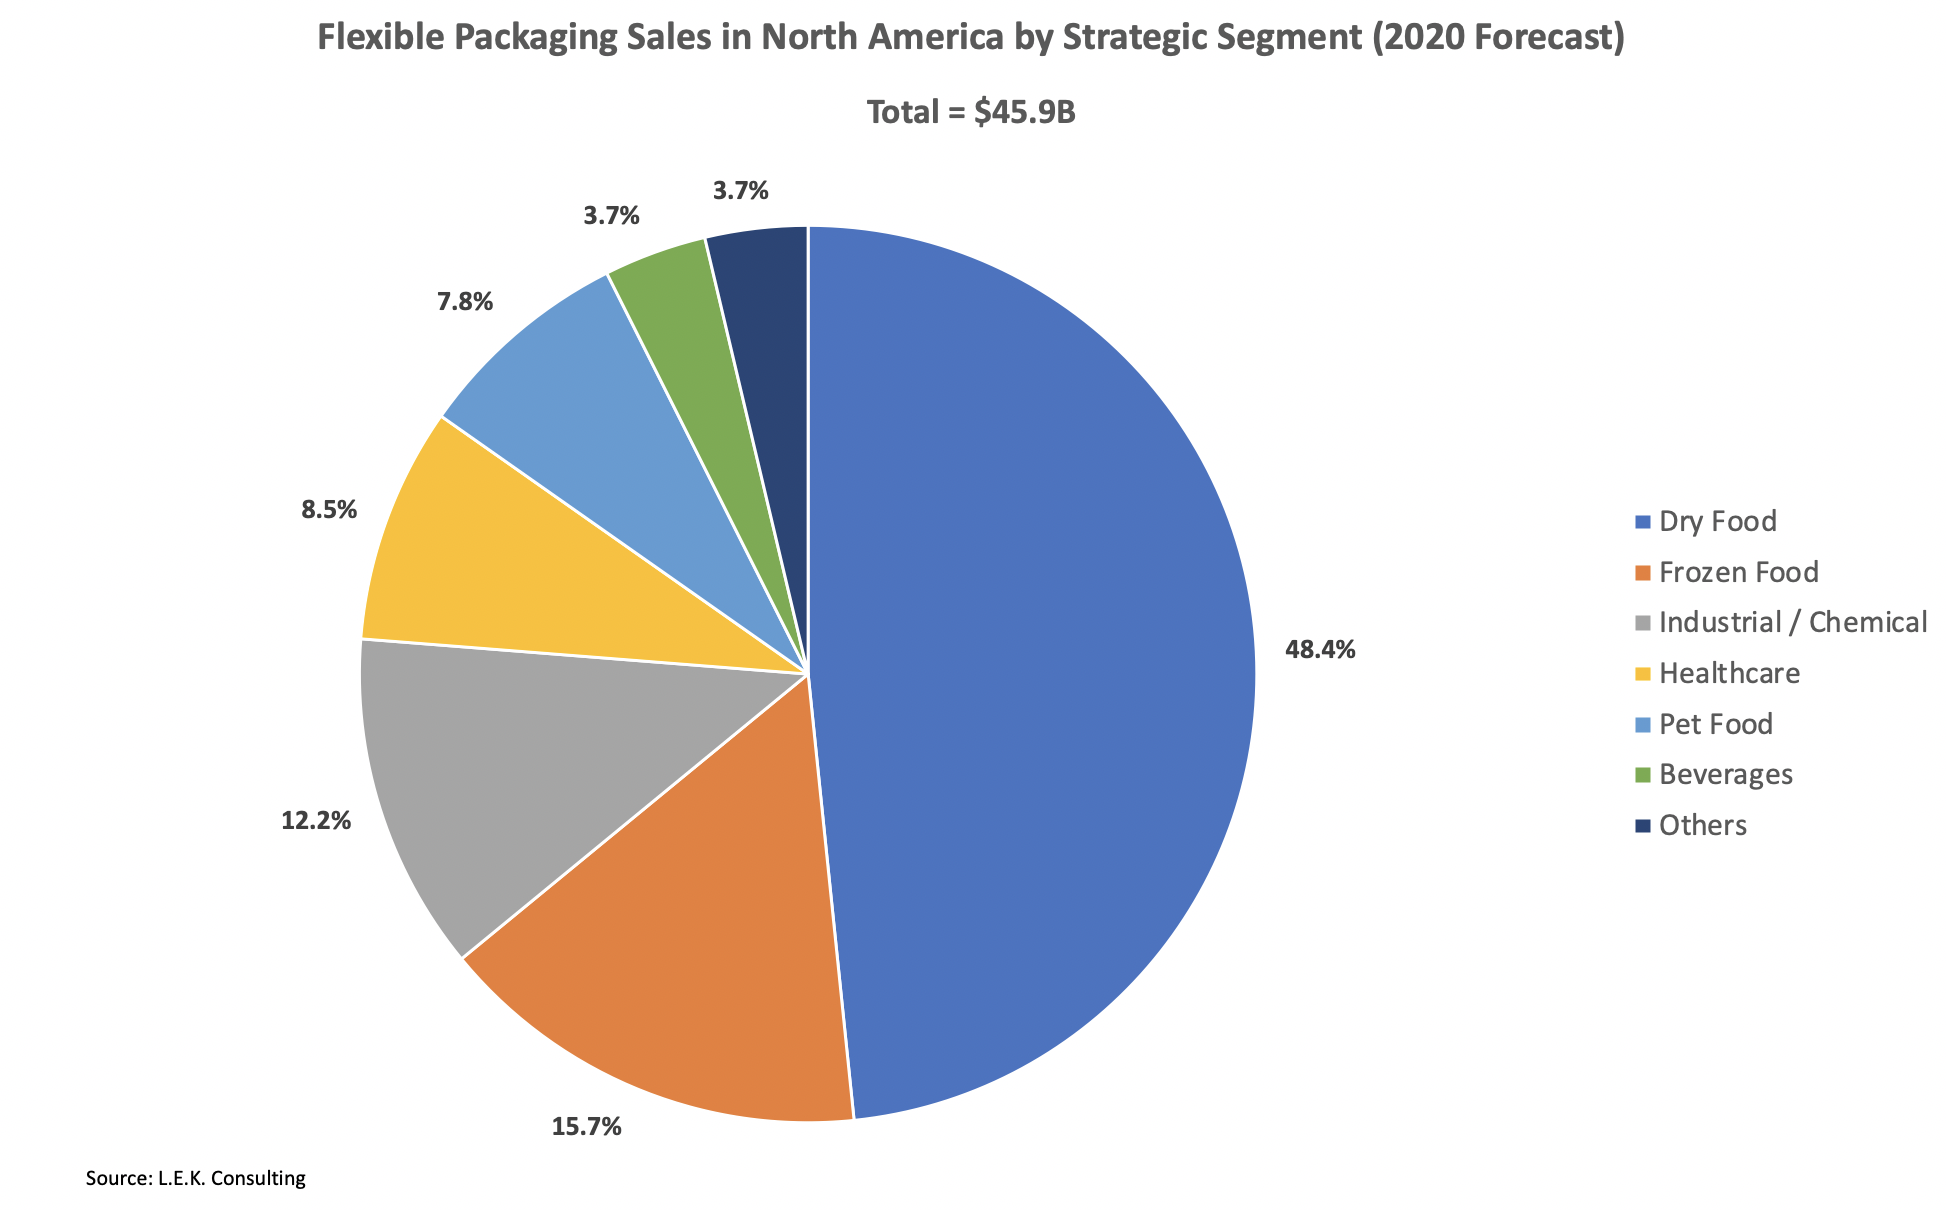
- The value of projects offered by Food & Beverages buyers to new vendors will probably be between 4% and 8% of total revenue in those market segments (about $1.6B to $3.1B).
- Buyers looking to introduce a new flexible packaging vendor are typically looking for: 1) better supply chain services, 2) lower manufacturing errors and defects, 3) access to lower raw material costs, and 4) greater flexibility in manufacturing volumes.
- Buyers shopping a project with new vendors will typically invite 3 to 5 potential candidates to submit an offer and in any case never more than 10.
Despite the limited available information, it was clear form those discussions that for all but a few of the largest companies in the industry the opportunity was large enough and could have a significant impact on equity value if managed successfully.
When sales teams in B2B industries with a fragmented demand and a relatively high average sales ticket start looking into what is required to accelerate new account acquisition, it becomes clear that outboud prospecting is the most cost effective and scalable approach to develop valuable market intelligence and to discover new sales opportunities available in the market.
Once a company's CEO and senior sales leaders are aligned with regard to the strategic value of account-based outbound prospecting and have been able to formulate preliminary estimates regarding the sales available for grab each year, the next question is about the best approach to validate the value creation opportunity.
Defining scope and required resources for a pilot program
For B2B companies with a compelling value proposition and a selling cycle typically spanning several months, a twelve months pilot program is usually the best way to validate initial assumptions regarding the nature and size of the market opportunity and a company relative competitive position.
In most cases, the best way to ensure a pilot program success is to identify an internal champion (either the VP of Sales or the VP of Marketing) and to partner with a specialized part-time interim executive that can help the company design the new processes, deploy the required technology tools, setup and lead a small multi-functional execution team with internal and external specialized professionals, and foster collaboration among all functions involved to ensure that for each new sales opportunity the company will deliver its very best.
On the other hand, the best time to hire a permanent leader for the new Sales Development Team is usually toward the end of the pilot program. In fact at that time, a company will usually be in a better position to formulate a compelling proposition and attract a truly qualified and talented professional having developed a better understanding of the size of the opportunity, the resources required to succeed, the importance of building an outbound prospecting capability, and set fair expectation regarding performance results.
The key decisions when planning for an outbound prospecting pilot program are the number of prospect accounts and contacts to be targeted, the activities to be performed, and therefore the professional resources required to execute.
With regard to the targeted number of prospect accounts and contacts, in our case we decided that during the initial 12-month pilot program we would target about 1,000 prospect accounts in the Food & Beverages industries and about 5,000 prospect contacts working in key functions and with appropriate titles at those accounts (reaching out to about 150 new prospect contacts each week).
With regard to team resources, the following requirements were identified:
- A part-time senior project leader ultimately responsible for the setup and optimization of all outbound prospecting activities spending 2.5 days each week during the initial 3 months and 1 day per week thereafter.
- A full-time Sales Development Rep (SDR) sending emails, making phone calls, managing replies, handling discovery calls, defining and managing A/B tests for email and voicemail templates, and handing off sales qualified leads to a designated Account Executive (a member of the existing Sales Team).
- A part-time Research Analyst spending 2.5 days each week researching prospects matching the defined ideal customer profile and adding contact and other required information to the CRM and Sales Engagement systems using a workflow automation tool.
- A Content Editor spending about 40 working days during the initial 3 months to write about 6 case studies and some website content and to support the editing of email and voicemail templates.
- A Sales Operations manager setting up and making required changes to the software tools used by the team, spending about 15 working days during the initial 3 months and about 1 day each month thereafter.
- A Graphic Designer spending about 20 working days during the initial 3 months to design the case studies eBook layout and the required website landing pages.
- A Frontend Web Developer spending about 15 working days during the initial 3 months to make the required changes and enhancements to the company's website.
The total estimated cost for the 12-month pilot program (including all team related expenses, expenses for data and productivity SaaS tools, and some contingency expenses) amounted to about $700,000 or $700 for each targeted account. The SDR position would be filled with a young member from the existing sales team that we would train appropriately and all other required resources would be outsourced. Because of the limited number of targeted accounts and the relatively high portion of fixed costs (i.e. program leadership, content development, web development, etc.), this was a case where the unit cost for targeted account would be relatively high.
Over a period of about 34 weeks following an initial 8 to 9 week setup period, each week the program would reach out to about 150 new prospect contacts (about 30 new prospect contacts each day). Each new prospect contact added to an outbound prospecting campaign would be touched about 7 to 9 times (using emails and calls/voicemails) over a period of 21 days. Every 4 weeks the program would take a one week break to analyze results in depth, define required changes for optimization, and to implement those changes.
In industries where the serviceable addressable market (SAM) includes 20,000 or more prospect accounts, we would design a pilot program to target at least about 5,000 accounts and 25,000 contacts. In such a case, the pilot program would require 5 Sales Development Reps, 2.5 Research Analysts, and some additional expenses for content (to produce 10 case studies and 5 videos) and for support functions (i.e. Sales Operations, Graphic Designer, and Frontend Developer). The total estimated 12-month cost for such pilot program would be about $1.5M resulting in a prospecting unit cost per targeted account of $300. During the initial pilot program some or all SDRs would also be outsourced and internal hiring would be postponed after the initial program validation period.
As we'll discuss in coming paragraphs, what's important for the financial success of an outbound prospecting program is not the absolute value of the unit cost per targeted prospect account but its value relative to the customer lifetime value (i.e. the sum of all customer revenue during the account lifetime) and the win rate (i.e. percentage of targeted prospect accounts converted into new customers). The higher are the expected customer lifetime value and win rate, the higher the amount that can be invested for the acquisition of a prospect account.
The decisions regarding how to scale the outbound prospecting program after the initial 12-month pilot program will depend on the results achieved during the initial 12-month validation period. Should the initial results reveal significant unanticipated issues, the program would be shut down after 6 to 9 months (a very unusual case given the preliminary work typically done before deciding to launch a pilot program).
Measuring success: tracking sales pipeline key metrics
Planning for and managing a data driven end-to-end sales process requires a specific set of financial and process metrics that in most cases are not systematically tracked and used by traditional B2B companies.
When it comes to sales metrics, it's often the case that different companies adopt slightly different definitions and that should not be reason for concern since what's important are not the specific definitions adopted but their consistent use across the entire sales organization and over time.
Also, while the absolute level of those sales metrics depends from many factors that are specific to each industry and company, the greatest insights often comes from watching how those sales metrics evolve over time and relative to planned performance targets.
In an Appendix to this article we have included a set of key sales metrics that can be used in a wide range of situations to plan for and measure the success of an outbound prospecting program. The ultimate measures of a sales program success are the revenue and free cash flow generated. However, to understand how to improve the sales process a set of more detailed process metrics is required.
The Appendix also includes a set of preliminary benchmarks used to set initial performance targets for sales conversion rate metrics and an hypothetical example to illustrate how small but consistent process improvements can drive large increases in the sales generated by each dollar invested in customer acquisition (i.e. the multiplicative effect of sales process improvements).
In the next and final section of this article we're are going to discuss the actual step-by-step development of the investment case. Readers unfamiliar with some of the terminology used for sales metrics can jumped to the Appendix at the bottom of the page to find the definitions for all the sales metrics used.
Building the investment case for outbound prospecting
Having introduced all the required building blocks we are finally ready to discuss how to develop an investment case for account-based outbound prospecting. The investment case is not a forecast, given the very limited amount of available market and company specific historical information, but a set of financial projections aimed at providing guidance for the execution team and an educated guess to the following two top management questions:
- Assuming things goes reasonably well, using conservative assumptions what is the upside financial impact that we could generate with this new initiative (base case)?
- Assuming instead that things will not go as well as originally anticipated, how will we avoid any deterioration of our net financial position at exit (worst case)?
To address those two questions one needs to first establish the company's financial baseline. In our case, the company's revenue during the past 12 months had been about $200M and in the next 4 years the company was expecting to add another $100M in revenue: about $40-45M coming from organic growth (mostly from existing accounts) and an additional $40-60M from one or two add-on acquisitions. EBITDA margin at the end of the period was projected to be about 12.5%.
Building the investment base case
The purpose of the investment base case is to provide an answer to the first top management question outlined above. The first required task to accomplish that is to develop top line projections with a four-step process.
The first step for top line projections is to decide the number of targeted prospect accounts. In our case, based on a preliminary analysis of the number of accounts in the serviceable addressable market (SAM) performed using a sales intelligence tool, we decided that in the first year we would target about 1,000 prospect accounts and that in the following three years we would scale up that number to about 2,000 prospect accounts targeted each year.
The second step for top line projections is to formulate reasonable assumptions regarding the sales pipeline key conversion rates. Since the company had no internal historical data for the engagement rate CR1, the qualification rate CR2, and the acceptance rate CR3 (see Appendix for all sales metrics definitions), we had to develop a quick competitive market analysis and rely on our generic performance benchmarks to develop an initial set of assumptions. For the conversion rate CR4, the company had some historical information showing conversion rates often in excess of 25%. However, we decided to make more conservative assumptions to account for differences in the profile of the targeted prospect accounts.
The third step for top line projections is to formulate an estimate for the average revenue generated by new customer accounts during the initial 12 months in their lifetime (ACV). Without reliable historical data and with estimates from sales team members ranging from as low as $300K and as high as $1M, we decided to take a conservative approach and set ACV initial value at $400K with a CAGR of 3% in each of the following years. To simplify the process we also assumed that the acquisition of new customer accounts would spread evenly troughout the year. ACV was the metric that could potentially have the largest upside.
Having defined those assumptions, we could elaborate our projections for new customer accounts and sales from new customer accounts acquired in each year. The results are illustrated in the table below.
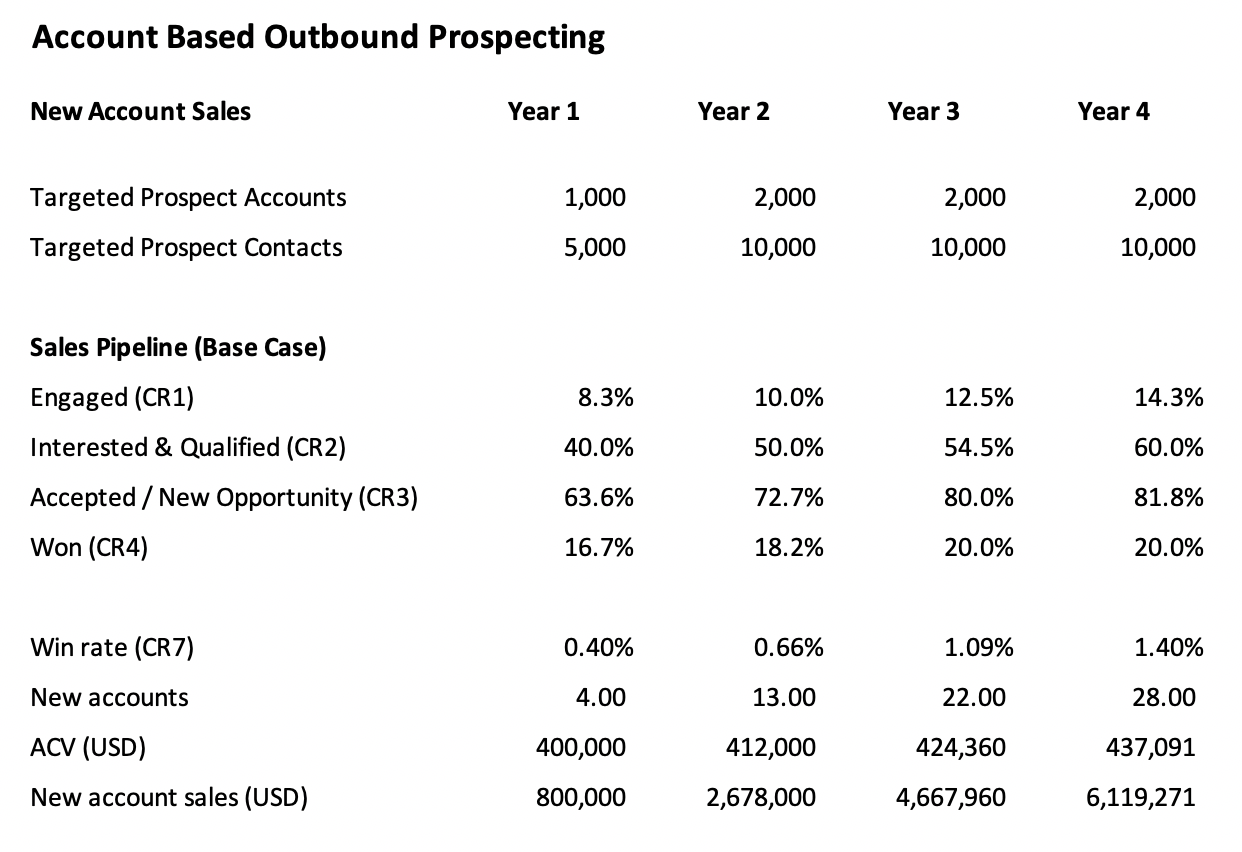
The combined assumptions we made for the key sales pipeline metrics, summarized by the values of the Win rate (CR7), are very tipical for outbound prospecting:
- The results in the first year are usually relatively modest as there is very little historical data available to guide the optimization of the different activities. For example, we assumed that the SDR would be able to engage only 1 in 12 prospect accounts and that AEs would be able to convert only 1 in 6 new sales opportunities. The main objectives during the first year are to deploy the new infrastructure, create the required new content and processes, and start collecting the quantitative and qualitative data that will help SDRs and AEs learn how to optimize their respective activities.
- In the following years, leveraging data and feedback from prospect accounts (gathered through hundreds of discovery calls and interactions) the team will learn how to optimize the different activities and the Win rate (CR7) will continue to improve. The optimization period usually last between 12 to 24 months.
In summary, our base case assumed that in the first year the Win rate (CR7) would be 0.40% (i.e. 1 won customer for every 250 targeted prospect accounts) and that in the fourth year the Win rate would improve to 1.40% (i.e. 1 won customer for every 70 targeted prospect accounts).
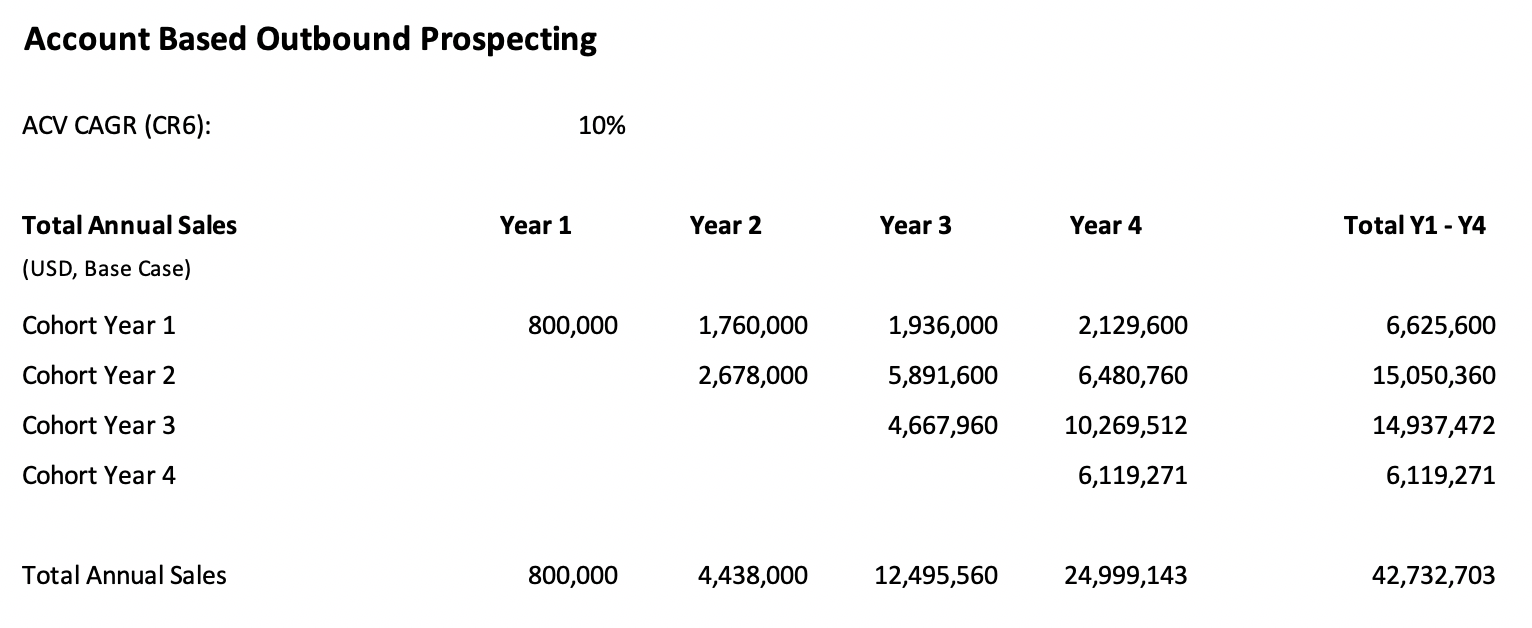
To appreciate the full contribution of an outbound prospecting program, however, one needs to calculate the total revenue generated by the program in each year. These will include both the revenue from the new accounts acquired in the specific year and the revenue from the new accounts acquired in prior years.
The fourth step required to complete top line projections, therefore, includes the calculation of total sales from all new customer accounts cohorts. In our case, given an estimated expansion rate (CR6) equal to 10%, we were able to calculate the projected total annual sales from the outbound program as illustrated below. While sales from new customer accounts acquired in Year 4 were projected at $6.12M, total sales in Year 4 from new customer accounts acquired during the four year period were projected at about $25.00M.
The following chart includes the projections illustrated above for both sales from new customer accounts acquired in any specific year (red line) and total sales from new customers accounts acquired in each specific year and years prior (blue line). Sales from new accounts typically grow linearly as the process is optimized and peak after a few initial years. Total sales from new accounts, on the other hand, grow esponentially as sales from current and prior cohorts add up and peak after a longer period of time determined by the length of customers' lifetime.
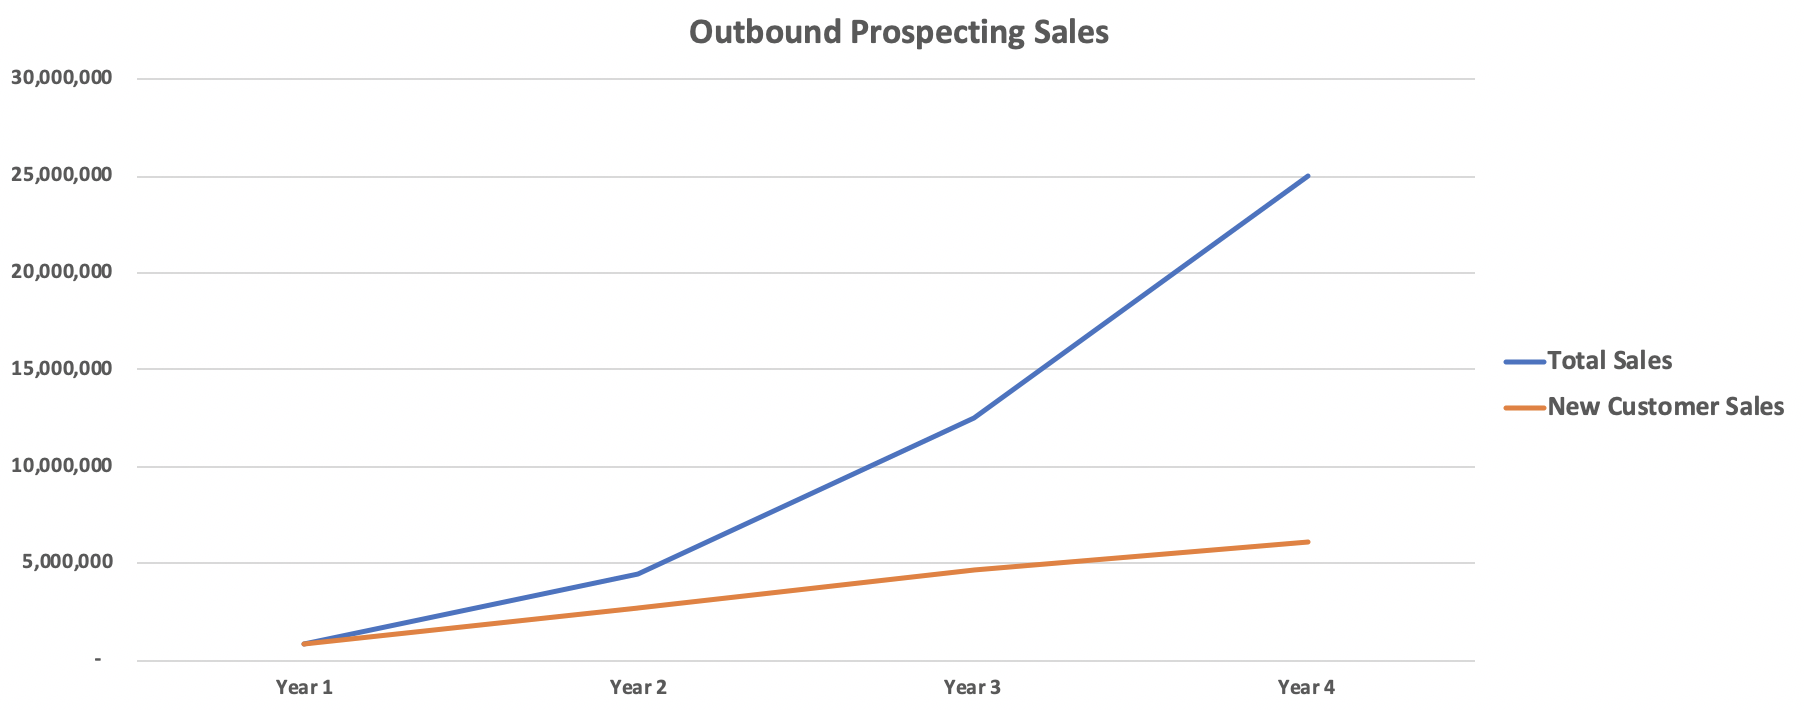
Because of the exponential dynamic of total sales, when appropriate, portfolio companies should start building their outbound prospecting capabilities withing the first 6 to 12 months following the completion of the buyout process as any delay would have a significant negative impact on valuation at exit.
In our case, for example, a one year delay in the launch of the program would result in a 50% reduction in Year 4 total projected sales (from $25.00M to $12.50M). When working on organic revenue growth, time is of the essence!
Having developed the revenue side of the investment base case, the next task is to develop projections for required expenses. In our case, the key assumptions made for the initial 12-month pilot program were discussed above. For the following three years we made the following assumptions:
- Research Analysts and SDRs: with the doubling of the targeted prospect accounts we would double the required resources. Starting from Year 2 the team would be fully insourced.
- Advisory & Team Leader: in the first year the pilot program would be designed and implemented by an external senior advisor. By the end of Q1Y2, a team leader for the Sales Development Team would be hired and the operational involvement of the senior advisor gradually phased out. In Year 3, the senior advisor would be available for 2 days each month in a mentoring and coaching capacity. In Year 4, the senior advisor involvement would be scaled down to 1.5 days each month.
- Investments in content and web development: investments would be scaled up gradually to allow for continuos improvement in sales enablement materials and in the company's online presence.
- Account Executives: starting from Year 2, the continuos increase in the number of accounts served would require additional hiring for this role. We assumed a first AE would be hired by the end of Q1Y2, a second by the end of Q1Y3, and a third by the end of Q1Y4. While the cost of AEs is not included in the calculation of the Prospecting Unit Cost or the Customer Acquisition Cost (CAC), they are included in the total budgeted cash expenses to allow for the calculation of the incremental free cash flow generated by the program.
- Cost estimates for internal hires: the budgeted cost include all cash expenses (i.e. total cash compensation, benefits, etc.) but does not include the cost of a long-term non cash performance based incentive program (i.e. stock options grants).
The table below illustrate the results of our projections.
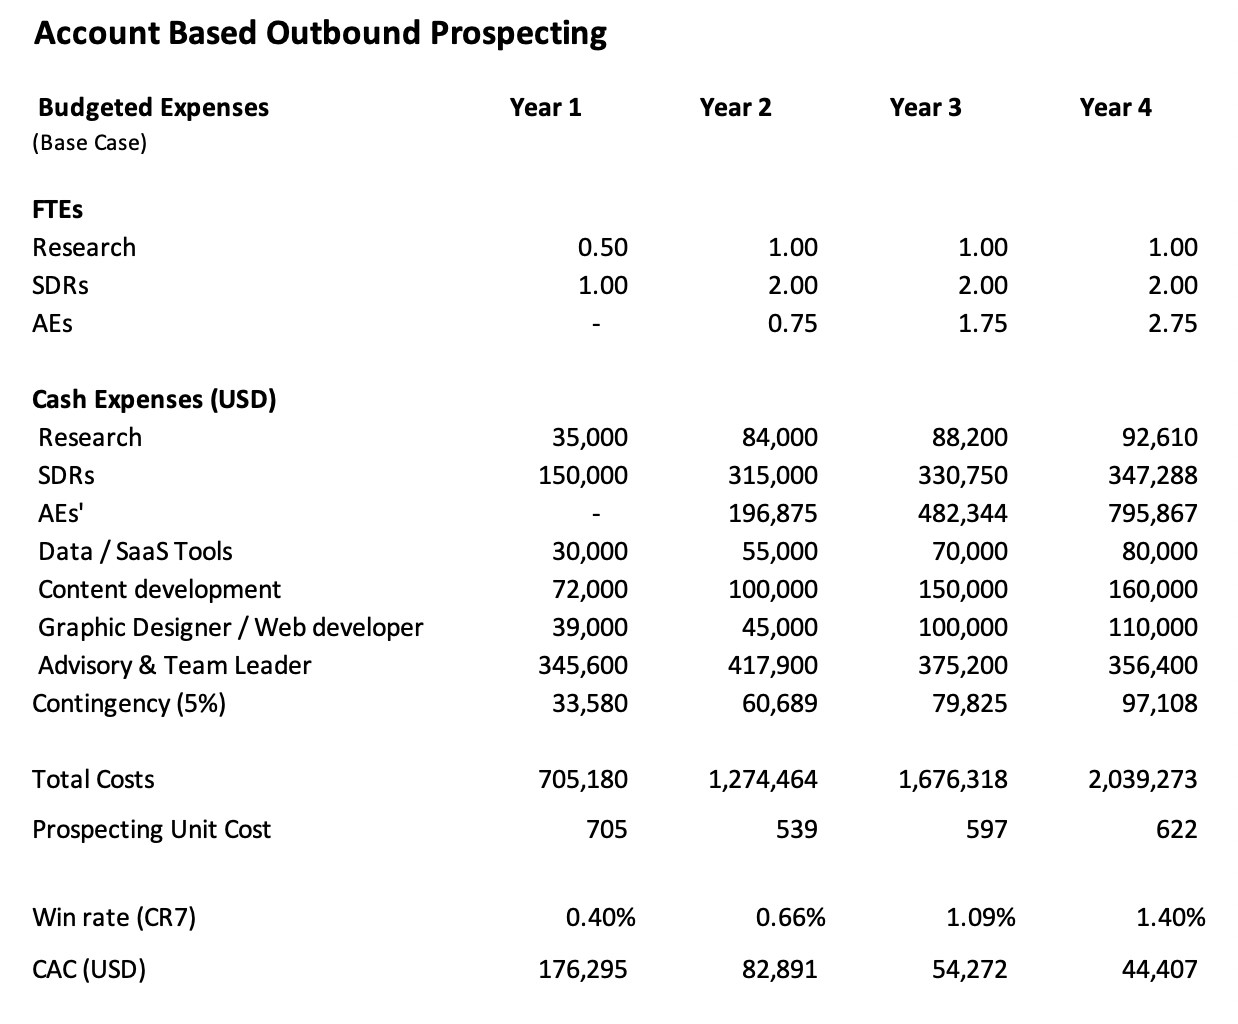
As it is typical with this kind of programs, our projections showed a declining CAC despite marginally greater investments in the prospecting program as a result of improving Win rates and greater economies of scale.
Having developed both revenue and cash expenses projections, the final task in the development of the investment base case is to calculate the program incremental impact on EBITDA and Free Cash Flow (FCF) and to provide an answer to the first top management question: what incremental financial impact could we expect from this new initiative assuming things will go reasonably well?
The table below illustrate the results of our calculations. As in our case serving the incremental demand would not require additional CAPEX, the incremental impact on EBITDA was also equal to the incremental impact on FCF.
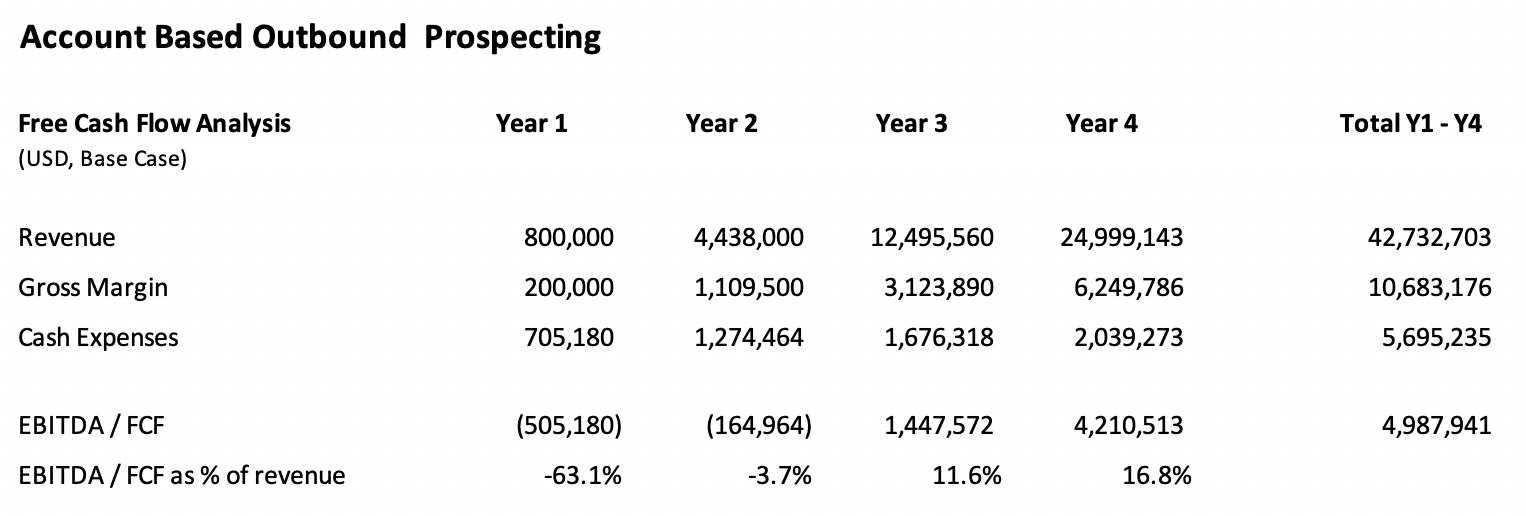
A new outbound prospecting initiative will typically have a negative impact on free cash flow during its first year, a close to breakeven or breakeven impact on free cash flow in the second year depending from both external and internal factors, and a clearly positive impact starting from the third year as revenue from multiple new customer accounts cohorts start adding up.
Relative to the company's baseline financial projections, our investment base case in Year 4 showed a potential 8.3% increase in revenue (from $300M to $325M), a potential 11.2% increase in EBITDA (from $37.5M to $41.7), and a $5M reduction in debt at the end of Year 4 with a clearly significant positive impact on equity value.
Building the investment worst case
A very important top management question at portfolio companies controlled by private equity firms is what would the impact be on the company net financial position should things turn out to be more challenging than originally anticipated. The development of an investment worst case is the best way to provide an answer to this very important question.
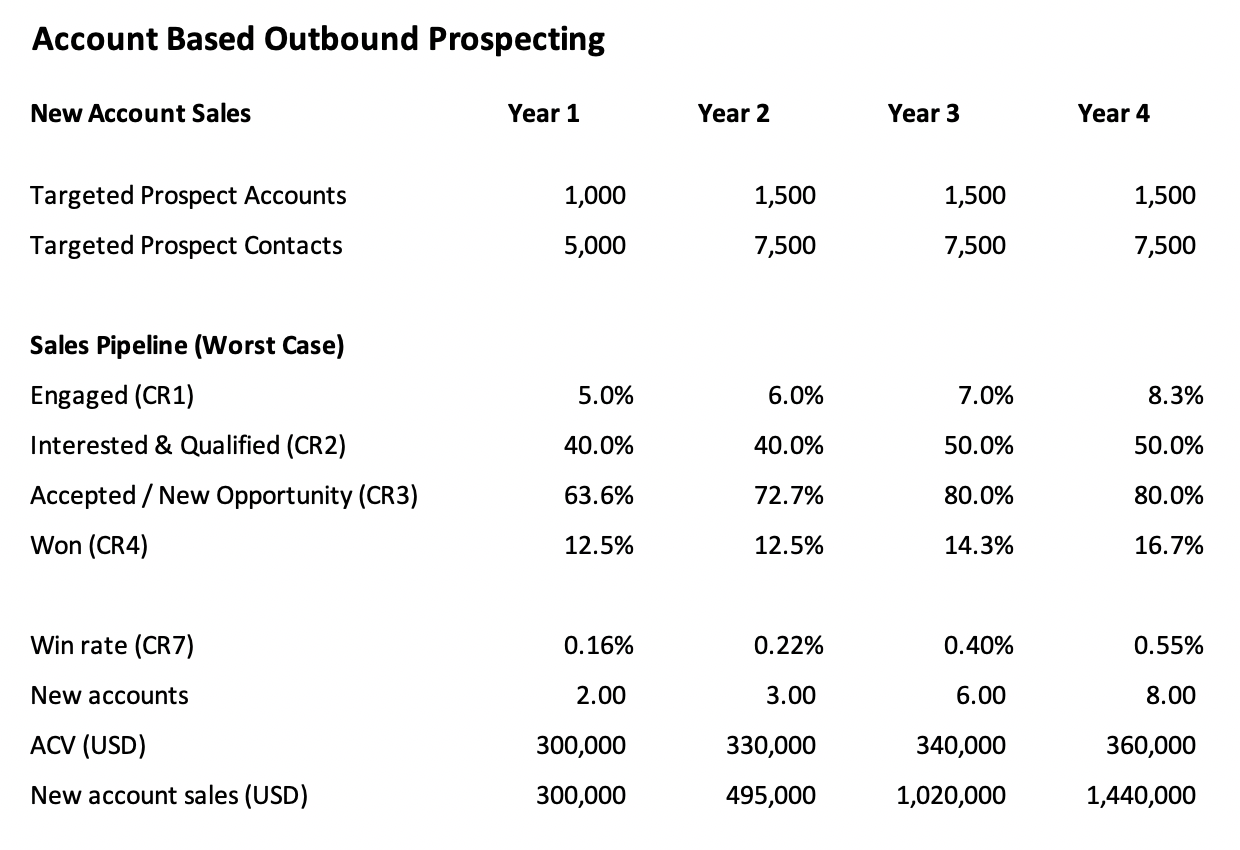
In our case, to simulate this scenario we made the following three assumptions:
- The serviceable addressable market would turn out to be 25% smaller than originally anticipated (i.e. 1,500 prospect accounts instead of 2,000).
- Due to a tougher than anticipated competitive environment, both SDRs and AEs would not be able to achieve the targeted performance levels and the number of new customer accounts acquired during the 4 year period would be significantly smaller (i.e. only 19 new accounts instead of the 67 new accounts projected in the base case, a 71.6% decline).
- The average revenue generated by new accounts during the initial 12 months in their lifetime (ACV) would result to be 25% smaller (i.e. $300K instead of $400K in Year 1).
The detailed assumptions and the resulting outcome in terms of new customer accounts and new customer accounts sales acquired each year are illustrated in the table below.
To compensate for the significant lower top line, we made the following adjustments in budgeted expenses:
- Research Analysts and SDRs: we would maintaine the same staffing levels with one Research Analyst and two SDRs starting from Year 2.
- Advisory & Team Leader: to compensate for the reduced impact, after the first six months the senior advisor involvement would be reduced by 50% and their contribution would be ultimately phased out by the end of Year 2. No additional team leader would be hired.
- Investments in content and web development: investments would be scaled down.
- Account Executives: given the lower number of new customer accounts only one additional AE would be hired by the end of Q3Y3.
The summary results for our worst case scenario are outlined in the table below.
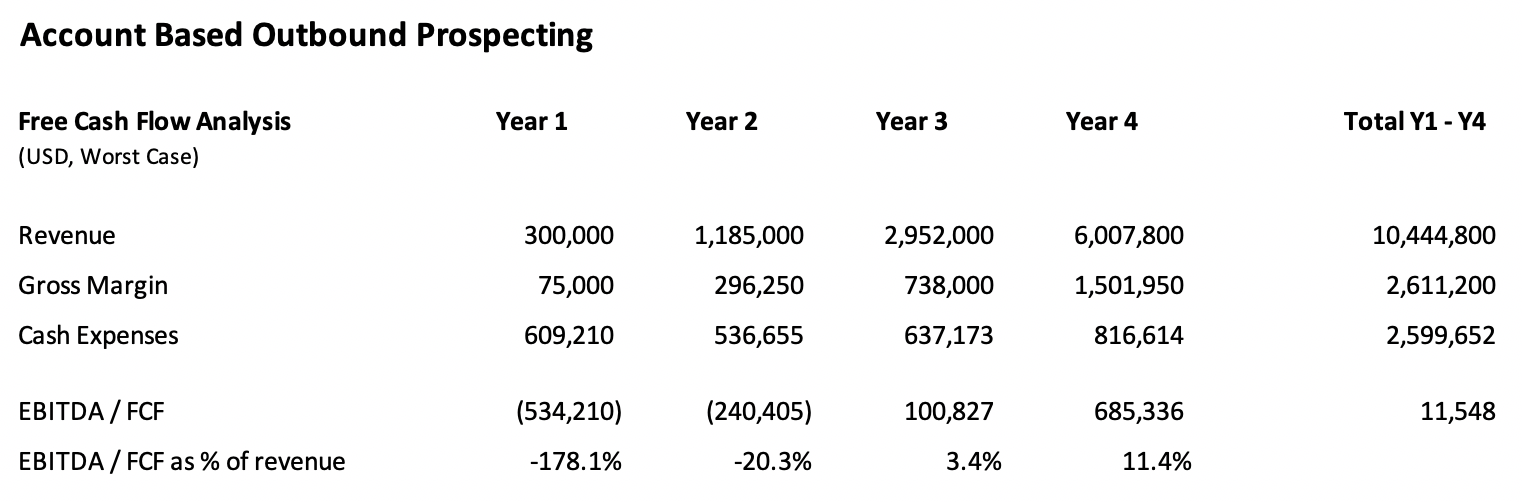
Even in a wost case scenario, if started early in the investment holding period, an outbound prospecting program will have no meaningful negative impact on a portfolio company's net financial position at exit and a marginally positive impact on revenue and EBITDA. If started late in the investment period, there might be a small negative impact on the net financial position at exit.
Conclusions
Leveraging a data driven, structured, and intelligently automated outbound prospecting capability to drive new customer accounts acquisition is nowadays a standard practice among leading Enterprise SaaS companies. Leading B2B companies operating in more traditional industries are also starting to embrace this digital approach to sales development.
Successful applications of outbound prospecting include companies operating in very disparate industries like, for example, a flexible packaging converter reaching out to about 2,000 food and beverages companies, a motor scooter manufacturer reaching out to targeted accounts among 7,500+ powersport dealers, or a high-end furniture marketplace reaching out to 100,000+ interior designers.
The case study discussed in this article was characterized by a very high LTV. However, successfull and profitable account-based outbound prospecting programs can be designed and implemented also for companies with an LTV as low as $100,000.
With a continued increase in competition within the private equity industry, more and more private equity firms are working with B2B portfolio companies to maximize top line growth. Leading firms have already developed significant capabilities to help portfolio companies with add-on acquisitions and organic growth at existing accounts. For many, learning how to accelerate the organic acquisition of new customer accounts is the next challenge and modern sales development and outbound prospecting practices and technologies the solution.
In the final article of this 3-part series we'll discuss how to setup and launch an outbound prospecting pilot program in 12 to 16 weeks.
Appendix: sales metrics data model and performance benchmarks
In this Appendix we're going to illustrate a set of key sales metrics that can be used in a wide range of situations to plan for and measure the success of an outbound prospecting program.
The Appendix also includes a set of preliminary benchmarks used to set initial performance targets and an hypothetical example to illustrate how small but consistent process improvements can drive large increases in the sales generated by each dollar invested in customer acquisition.
Introducing a sales metrics data model
Today many companies are excited about the amount of data that is flowing into their customer relationship management or marketing automation systems. However, with the explosion of data, they often get lost when it comes to how to interpret it. This can result in no action or bad actions.
The first step required to properly use data to improve the efficiency and effectiveness of a sales process is to define the reference data model and this is what we're going to discuss in this appendix.
Sales metrics can be defined in reference to accounts or individuals (often identified as contacts). Since in B2B industries the most useful way to plan for and manage the sales process is by referencing accounts, we are going to use account based metrics.
A first set of useful metrics includes the following Financial Metrics:
| METRIC | DEFINITION |
|---|---|
| PUC | Prospecting Unit Cost: total cost of the outbound prospecting program in any given period (i.e. one year) divided by the total number of targeted prospect accounts. Depends from the number of channels and touches used in the outreach sequences, the quality of the data used and the content developed to generate curiosity and interest, and the seniority of the Sales Development Reps. |
| CAC | Customer Acquisition Cost: investment required to acquire a new customer. Can be calculated by dividing the total cost of the outbound prospecting program in any given period by the total number of new customer accounts acquired or by dividing the prospecting unit cost by the percentage of prospect accounts converted into paying customer accounts (win rate). Depends from both the activities performed and the effectiveness of those activities. |
| ACV | Average Contract Value: measure the revenue generated by a new customer account during the initial 12 months of its lifetime. It's used also when customers don't actually sign a contract but simply place sales orders. |
| LTV | Lifetime Value: measure the total revenue a customer account generates over its lifetime, net of attrition and including growth. |
The formulas used to calculate CAC and LTV are included at the end of this appendix.
A second set of useful metrics includes sales process key metrics that can be grouped into volume metrics, conversion rate metrics, and time metrics.
The following table includes the first group of key Volume Metrics:
| METRIC | DEFINITION |
|---|---|
| PRO | Prospect: an account that fits the target profile (i.e. an account that matches the ideal customer profile). |
| LEAD | Lead: an account with one or more individuals that have expressed some interest by visiting a website, downloading a piece of content, or filling in a form. This is not used in outbound prospecting and is instead used for inbound marketing campaigns. |
| MQL | Marketing Qualified Lead: an account that fits the target profile with one or more linked contacts that have expressed interest by performing one or more engagement actions (i.e. replied to email, downloaded content from website, etc.). |
| SQL | Sales Qualified Lead: an engaged account that fits the target profile with one or more linked contacts with authority that have expressed interest in connecting with an Account Executive and an intention to take action in the near future (i.e. purchase a product or service to solve a problem). |
| SAL | Sales Accepted Lead: a sales qualified lead accepted by an Account Executive. Sometimes an AE might reject an SQL either because the account turned out not to be a good fit (in which case the account is disqualified) or because the account it’s not ready to make a purchase to solve a problem in the near future (in which case the account is left with the SDR for further nurturing untill ready). |
| CUST | Customer: an account that has placed only the first order. |
| RCUST | Repeat Customer: an account that has placed two or more orders. |
| DISQ | Disqualified: an account that has not engaged over a prolonged period of time (i.e. two years), that has asked to be removed from list, or that has been deemed not to be a good fit. |
Maintaning a centralized and shared list of accounts properly classified and with quality information is very important to manage a sales process, quickly assess performance, and formulate accurate forecasts.
The next table includes the second group of key Conversion Rate Metrics:
| METRIC | DESCRIPTION |
|---|---|
| CR1 | PRO -> MQL: engagement rate, percentage of targeted prospect accounts converted into qualified marketing leads. Depends from the quality of the prospects database and outbound prospecting campaigns. |
| CR2 | MQL -> SQL: qualification rate, percentage of marketing qualified leads converted into sales qualified leads. Depends from the quality of the sales enablement material (i.e. case studies, etc.) and the ability of SDRs to identify accounts that are a good fit and trigger their interest to connect with an AE to discuss how to solve a problem. |
| CR3 | SQL -> SAL: acceptance rate, percentage of sales qualified leads that are accepted by AEs and turned into a new sales opportunity. Depends on the ability of SDRs to hand-off properly qualified leads. |
| CR4 | SAL -> CUST: conversion rate, percentage of new sales opportunities converted into a new paying customer account. Depends from AEs ability to prove benefits and overcome objections. |
| CR5 | Annual Attrition Rate: percentage of last year active customer accounts that did not generate any revenue in the current year. Indicative of the stickiness of the product or service. Lack of impact results in attrition. |
| CR6 | Expansion Rate: average compounded annual revenue growth rate during the customer lifetime. Depends from AEs ability to prove impact, upsell, and cross-sell. |
| CR7 | Win Rate: percentage of targeted prospect accounts converted into paying customers. It is the product of the first four conversion rates (CR7 = CR1 x CR2 x CR3 x CR4). |
In a modern sales organization the Sales Development Team is responsible for optimizing CR1, CR2, and CR3 and AEs for optimizing CR4, CR5, and CR6.
The final table includes the third group of key Time Metrics:
| METRIC | DESCRIPTION |
|---|---|
| ∆T1 | Duration of prospecting before engagement is achieved, indicative of the quality of content and messaging. |
| ∆T2 | Duration of the qualification period, indicative of a company competitive position and SDRs' abilities. |
| ∆T3 | Time required to setup meetings with AEs and transition new qualified sales opportunities. |
| ∆T4 | Sales cycle or time required to convert new sales opportunities into customers. Depends from the complexity of the product or service and the ability of AEs to navigate through the client's process. |
| ∆T5 | Time until a client achieve the desired initial impact and AEs can start discussions about potential expansion opportunities. |
| ∆T6 | Time to achieve maximum share of wallet penetration at an account. |
Historical data regarding sales process metrics is a very valuable asset that can be used to understand what priority actions should be taken to improve performance and also to produce more reliable forecasts.
When trying to understand how to accelerate sales from new accounts, for example, looking at the volume of new sales opportunities (SAL) generated in any given period and the relative historical conversion rate (CR4) will help sales executives better understand what should be done to achieve the desired results.
Similarly, when trying to produce an accurate forecast about sales from new accounts to be expected in any future period, knowing the average number of months it takes to convert a new sales opportunity into a new customer (∆T4), the average value for the conversion rate (CR4), and the volume of new sales opportunities (SAL) generate ∆T4 months prior, will help sales executives formulate more reliable predictions.
When starting a new outbound prospecting program, however, historical data will not be available and a set of preliminary performance benchmarks will therefore prove useful. That is the topic discussed in the next section.
Establishing preliminary performance targets for conversion rate metrics
Building an investment case for a new outbound prospecting program hinges on three key decisions: how many prospect accounts to target, how much to invest in the program (the Prospecting Unit Cost), and what performance targets to set for the sales process key conversion rate metrics.
When historical data is not available, setting meaningful performance targets for conversion metrics is an articulated task that requires an industry and competitive analysis, the analysis of historical data regarding sales and sales opportunities, and experience with designing and optimizing B2B sales pipelines.
The table below provides a good starting point applicable to many traditional B2B industries with a relatively high average sales ticket.
| METRIC | POOR | GOOD | GREAT |
|---|---|---|---|
| CR1 | =< 8% | 10% - 15% | => 20% |
| CR2 | =< 33% | 40% - 50% | => 60% |
| CR3 | =< 60% | 80% - 90% | => 95% |
| CR4 | =< 12% | 15% - 20% | => 25% |
| CR5 | => 10% | 3.5% - 5% | < 3.5% |
| CR6 | =< 5% | 10% - 15% | => 20% |
| CR7 | =< 0.25% | 0.50% - 1.50% | => 2% |
In most cases, converting targeted prospects into paying customers (CR7) at an annual rate ranging between 0.50% and 1.50% will be feasible, indicative of a well functioning sales process, and a great opportunity for value creation. Winning rates of 2% of more will only be achieved by companies with a very competitive and unique value proposition. Prospect accounts that will not be won in any given year, if not disqualified, will continue to be targeted in following years.
Also, B2B companies that can prove impact and provide superior customer service will usually benefit from very low annual attrition rates (CR5). An attrition rate of 5% or less, resulting in a customer lifetime of 10 years or more, will be indicative of a good performance and also a very good value creation opportunity.
Finally, as B2B buyers typically like to test new vendors with a relatively small level of initial spending and only expand their business with those vendors that can deliver impact and superior customer service, leading B2B companies will typically benefit from relatively high expansion rates. A compounded average growth rate of annual revenue of 10% or more during a customer's lifetime, once again, will be indicative of good performance and a significant value creation opportunity.
Understanding the math that drives revenue growth
When focusing on accelerating organic growth, it's important to realize that revenue is the product of sales process conversion rates creating multiplicative impact. Massive changes in outcome are therefore possible by making marginal improvements in the performance of single tasks within the sales process.
To illustrate this concept, we are going to analyze an hypothetical case in which starting from a good level of performance each key conversion rate in the sales process is improved by 20%. The table below outlines the key assumptions before and after the 20% improvement.
| METRIC | BEFORE | AFTER |
|---|---|---|
| CR1 | 10% | 12% |
| CR2 | 50% | 60% |
| CR3 | 75% | 90% |
| CR4 | 15% | 18% |
| CR5 | 5% | 4% |
| CR6 | 10% | 12% |
| CR7 | 0.56% | 1.17% |
| UNIT COST | $700 | $700 |
| ACV | $420,000 | $420,000 |
In the Before situation, with a prospecting unit cost of $700 and a win rate equal to 0.56%, the average cost of acquiring one customer (CAC) would be equal to $125,000. The average customer would generate $420K in revenue during the first 12 months of its lifetime (ACV) and $6.69M in total revenue during its entire lifetime (LTV).
In the After situation, assuming a 20% improvement in the CR1 to CR6 conversion rates, the CAC would decline to $60,096 due to the resulting increase in the overall win rate (CR7). In this case, the same $125,000 investment in customer acquisition would yield a greater number of new customer accounts (specifically, 2.08 new customer accounts). These customers would generate $873,600 in revenue during the first 12 months of their lifetime and $22.78M in total revenue during their entire lifetime (LTV).
Relative to the Before situation, therefore, for every one dollar invested in customer acquisition a 20% improvement in all sales process conversion rates would generate a 2.08x increase in the revenue generated during the first 12 months of customers' lifetime and a 3.40x increase in the revenue generated during customers' total lifetime.
The customer acquisition cost (CAC) and the customer lifetime value (LTV) were calculated using the following formulas:
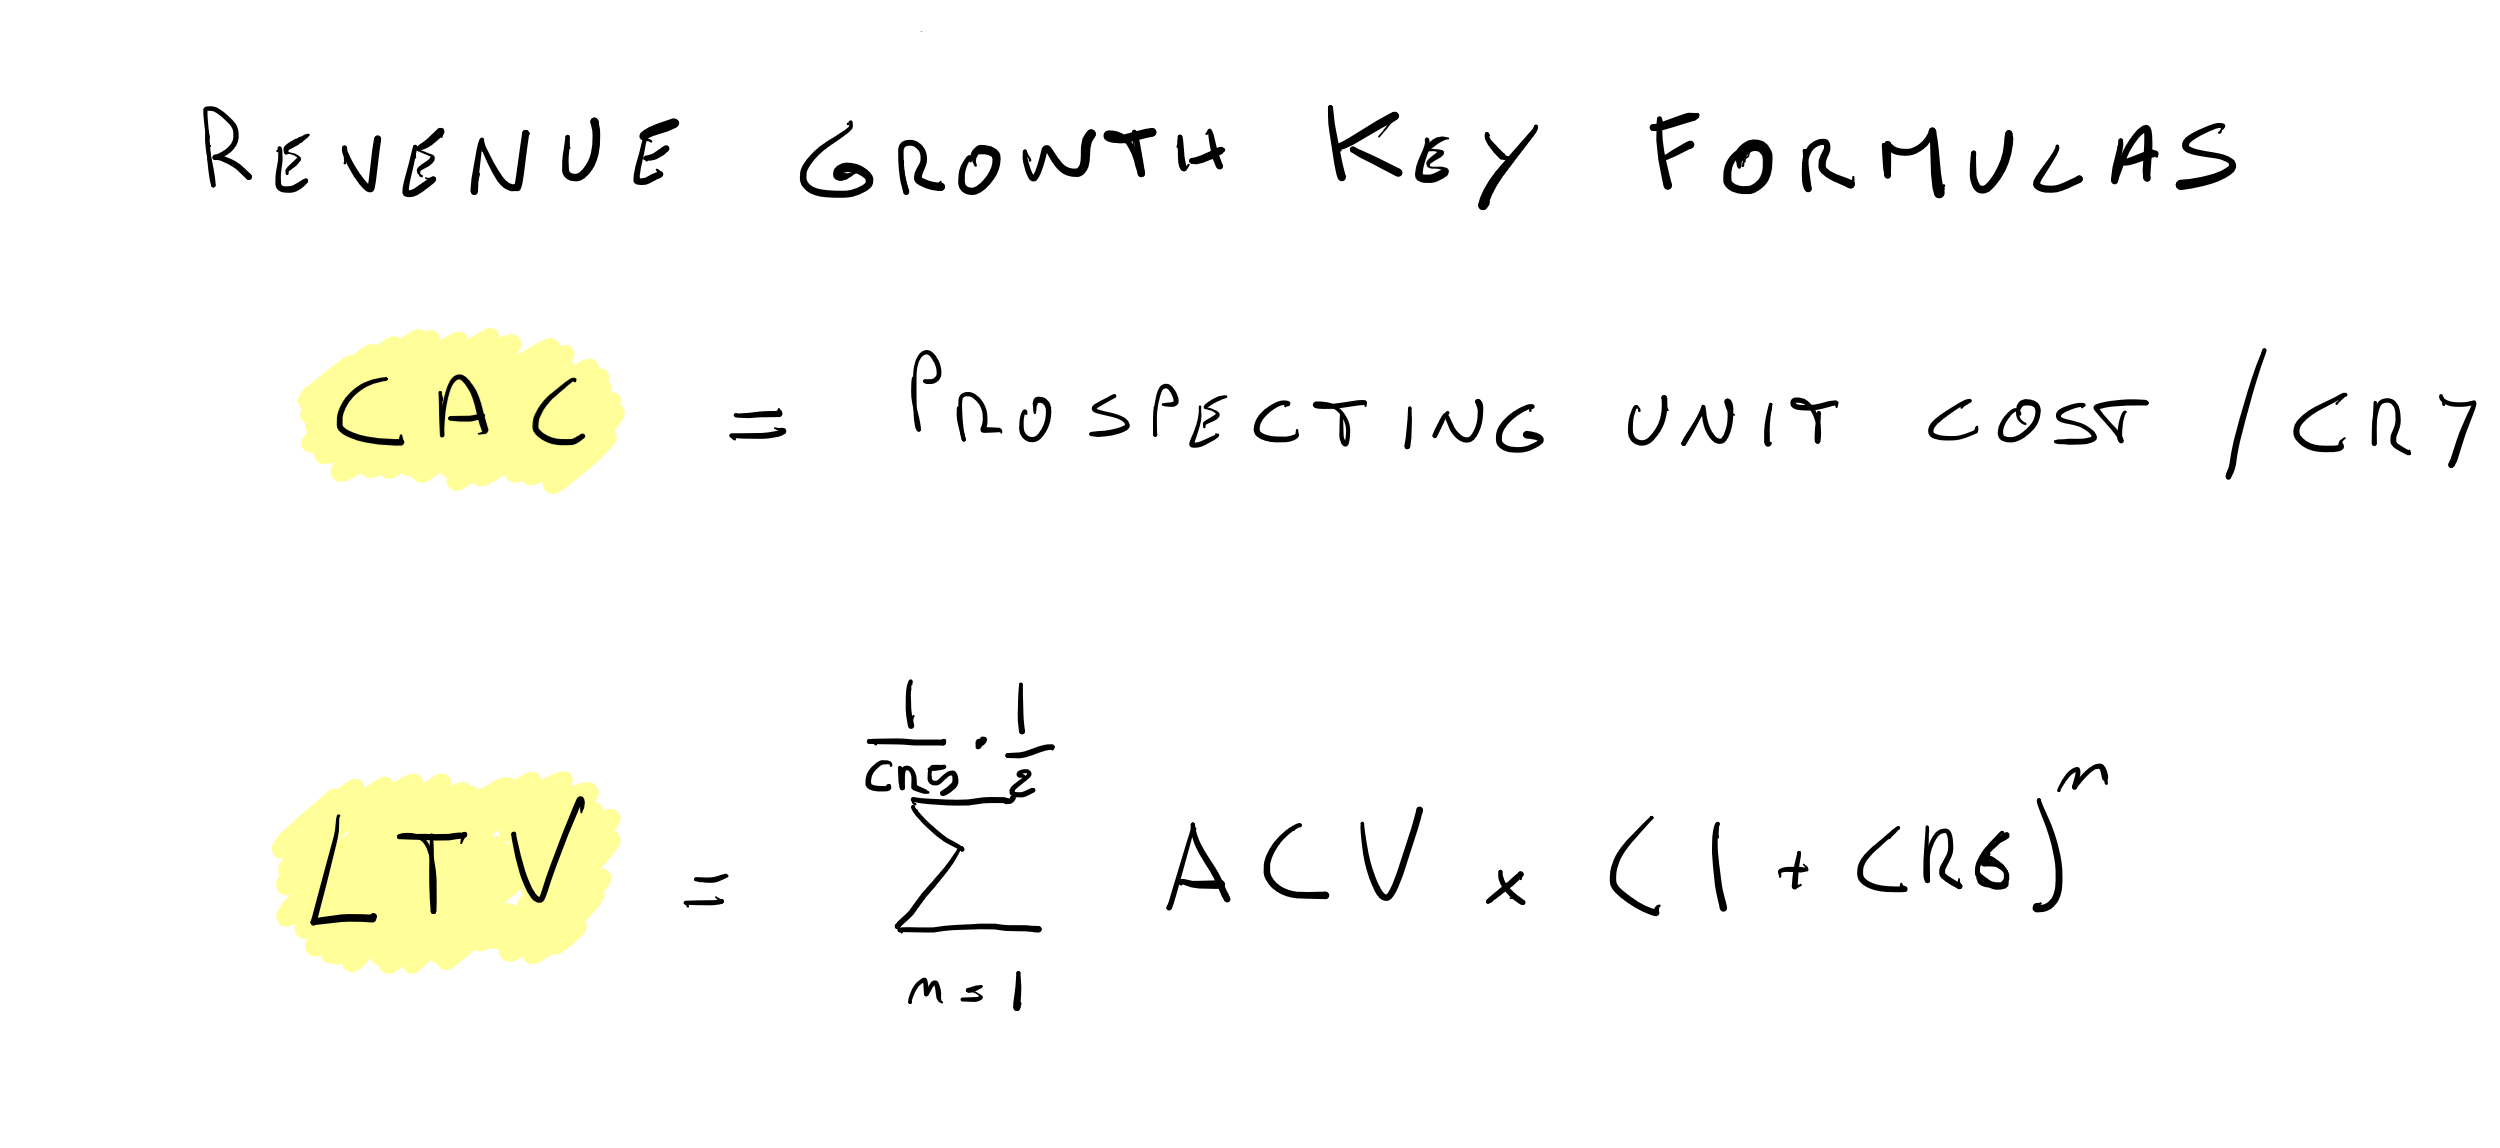
Back to the building the investment case for outbound prospecting section.