Hunting for Profit with Modern Data Technologies

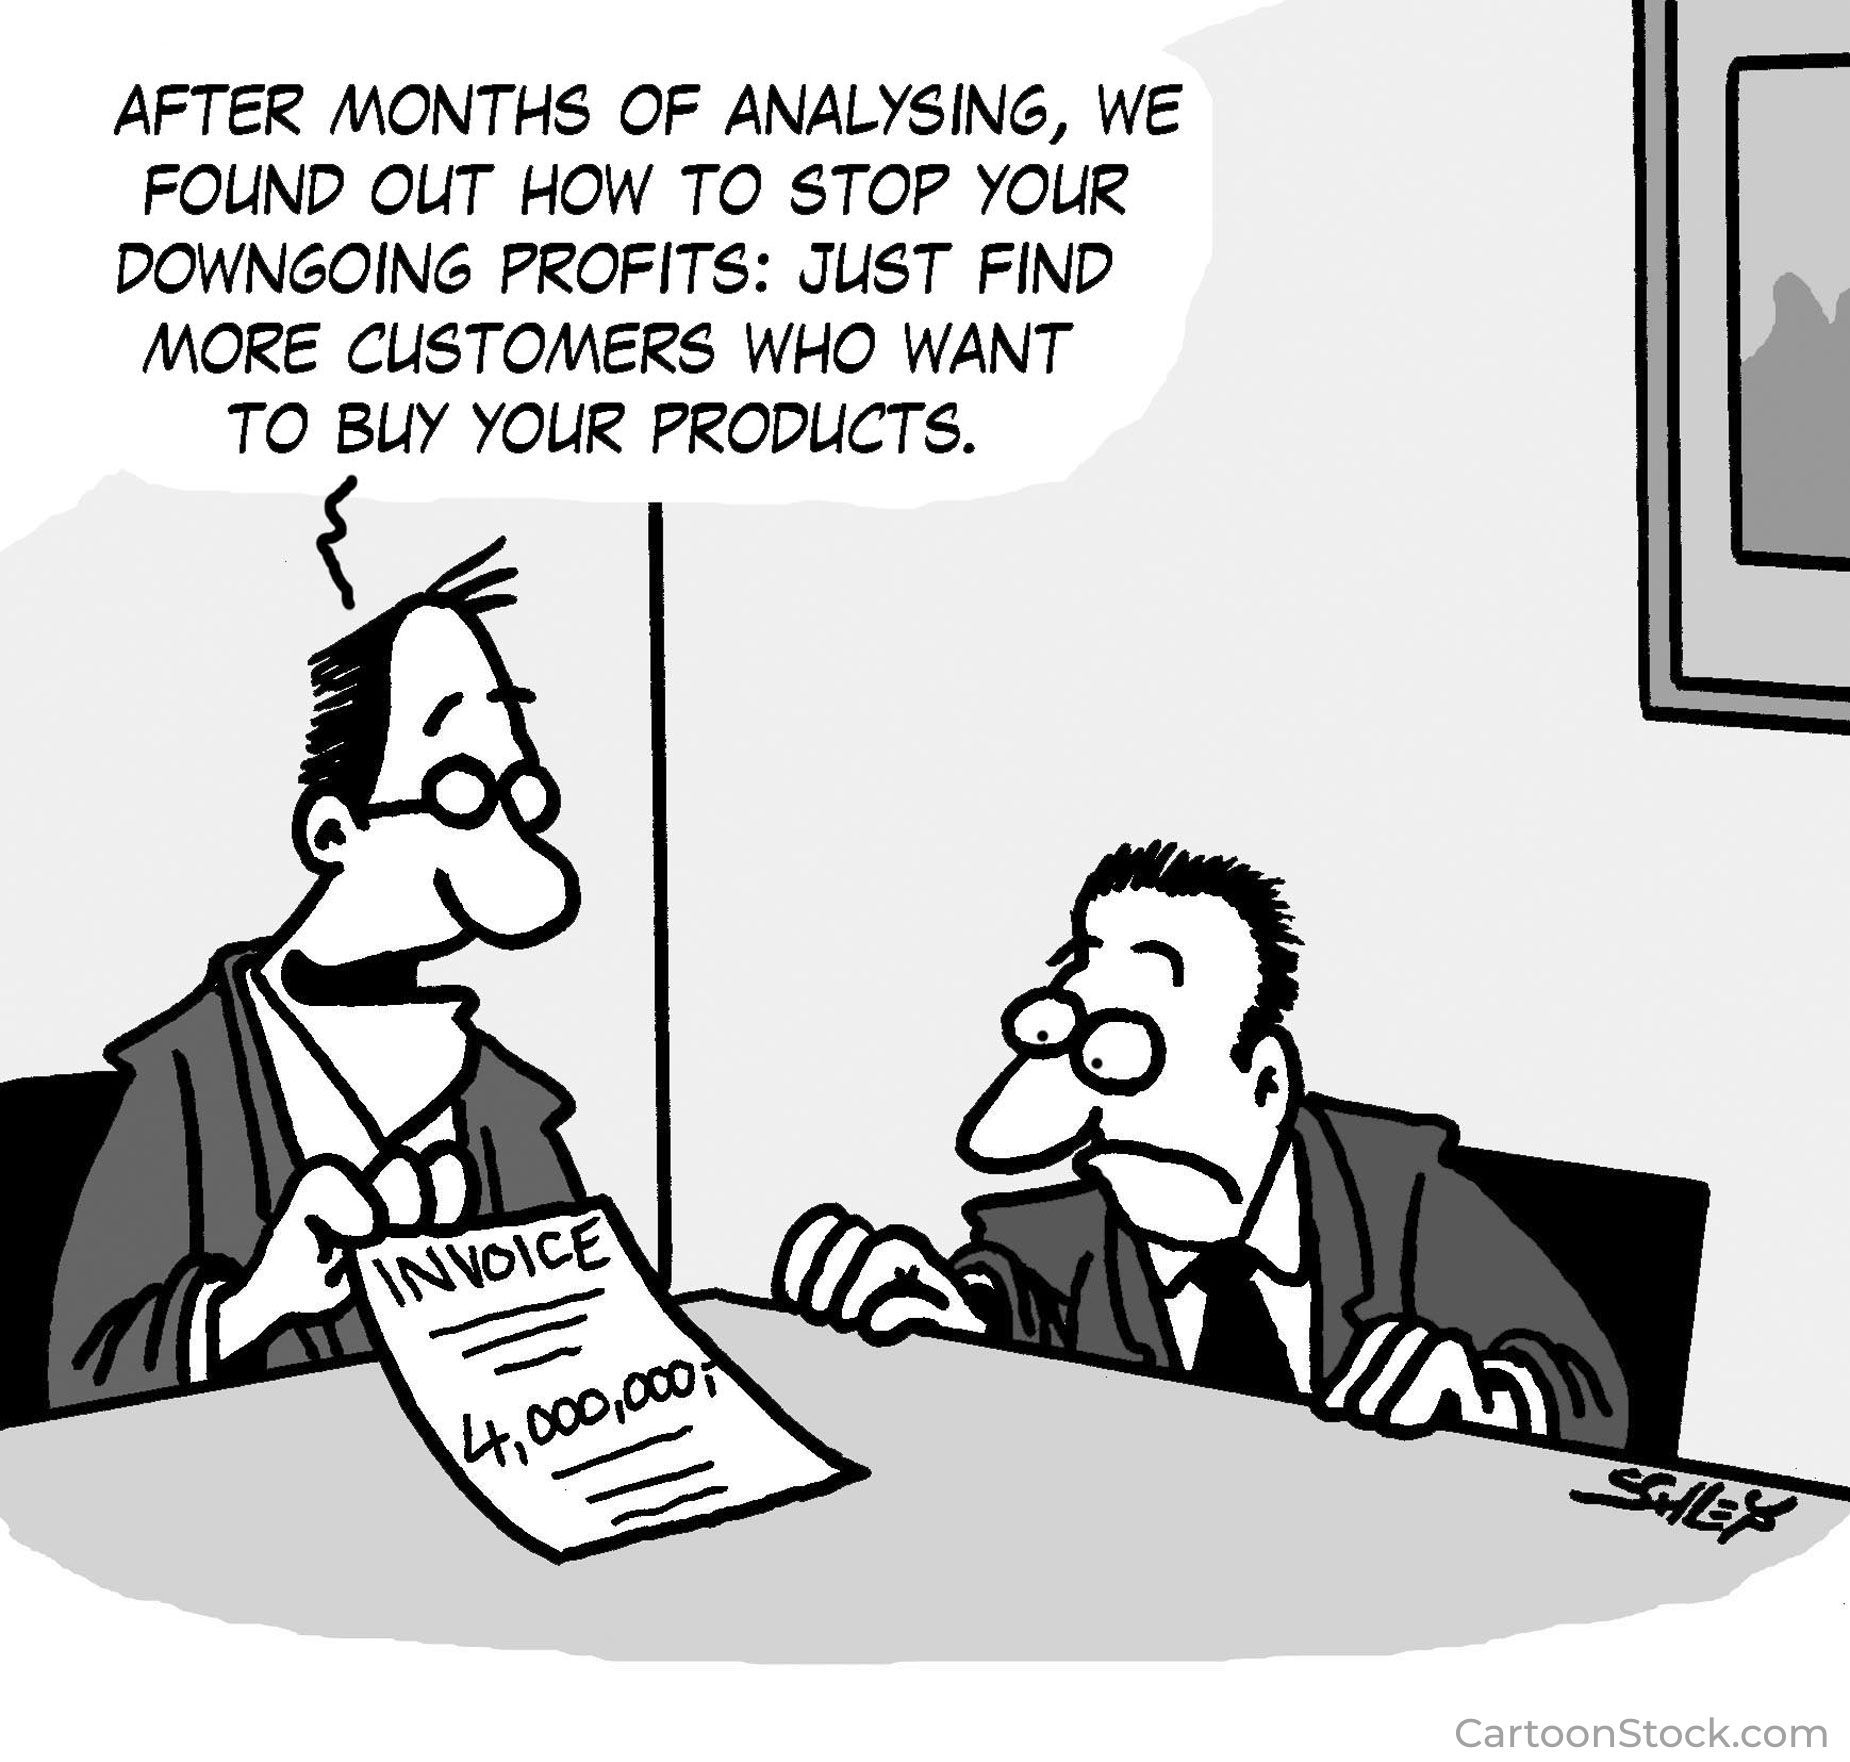
Islands of Profits in a Sea of Red Ink
As Jonathan Byrnes discovered many years ago through his research and consulting work, at too many companies in a wide range of industries, between 30 to 40 percent of the business is unprofitable by any measure (i.e., accounts, products, orders, vendors, sales channels, etc.), and 20 to 30 percent is so profitable that it provides all the reported earnings and cross-subsidizes the losses. The rest of the company is only marginal.
This astonishing findings, initially revealed in Harvard Business School's Working Knowledge e-newsletter and graduate and executive courses at MIT, were ultimately published in a seminal book titled "Islands of Profit in a Sea of Red Ink".
The main issue is that many management processes and information systems (e.g., ERP systems) currently used in business were created during a time of mass production and distribution when general management metrics such as total revenue and costs were sufficient for maximizing profit.
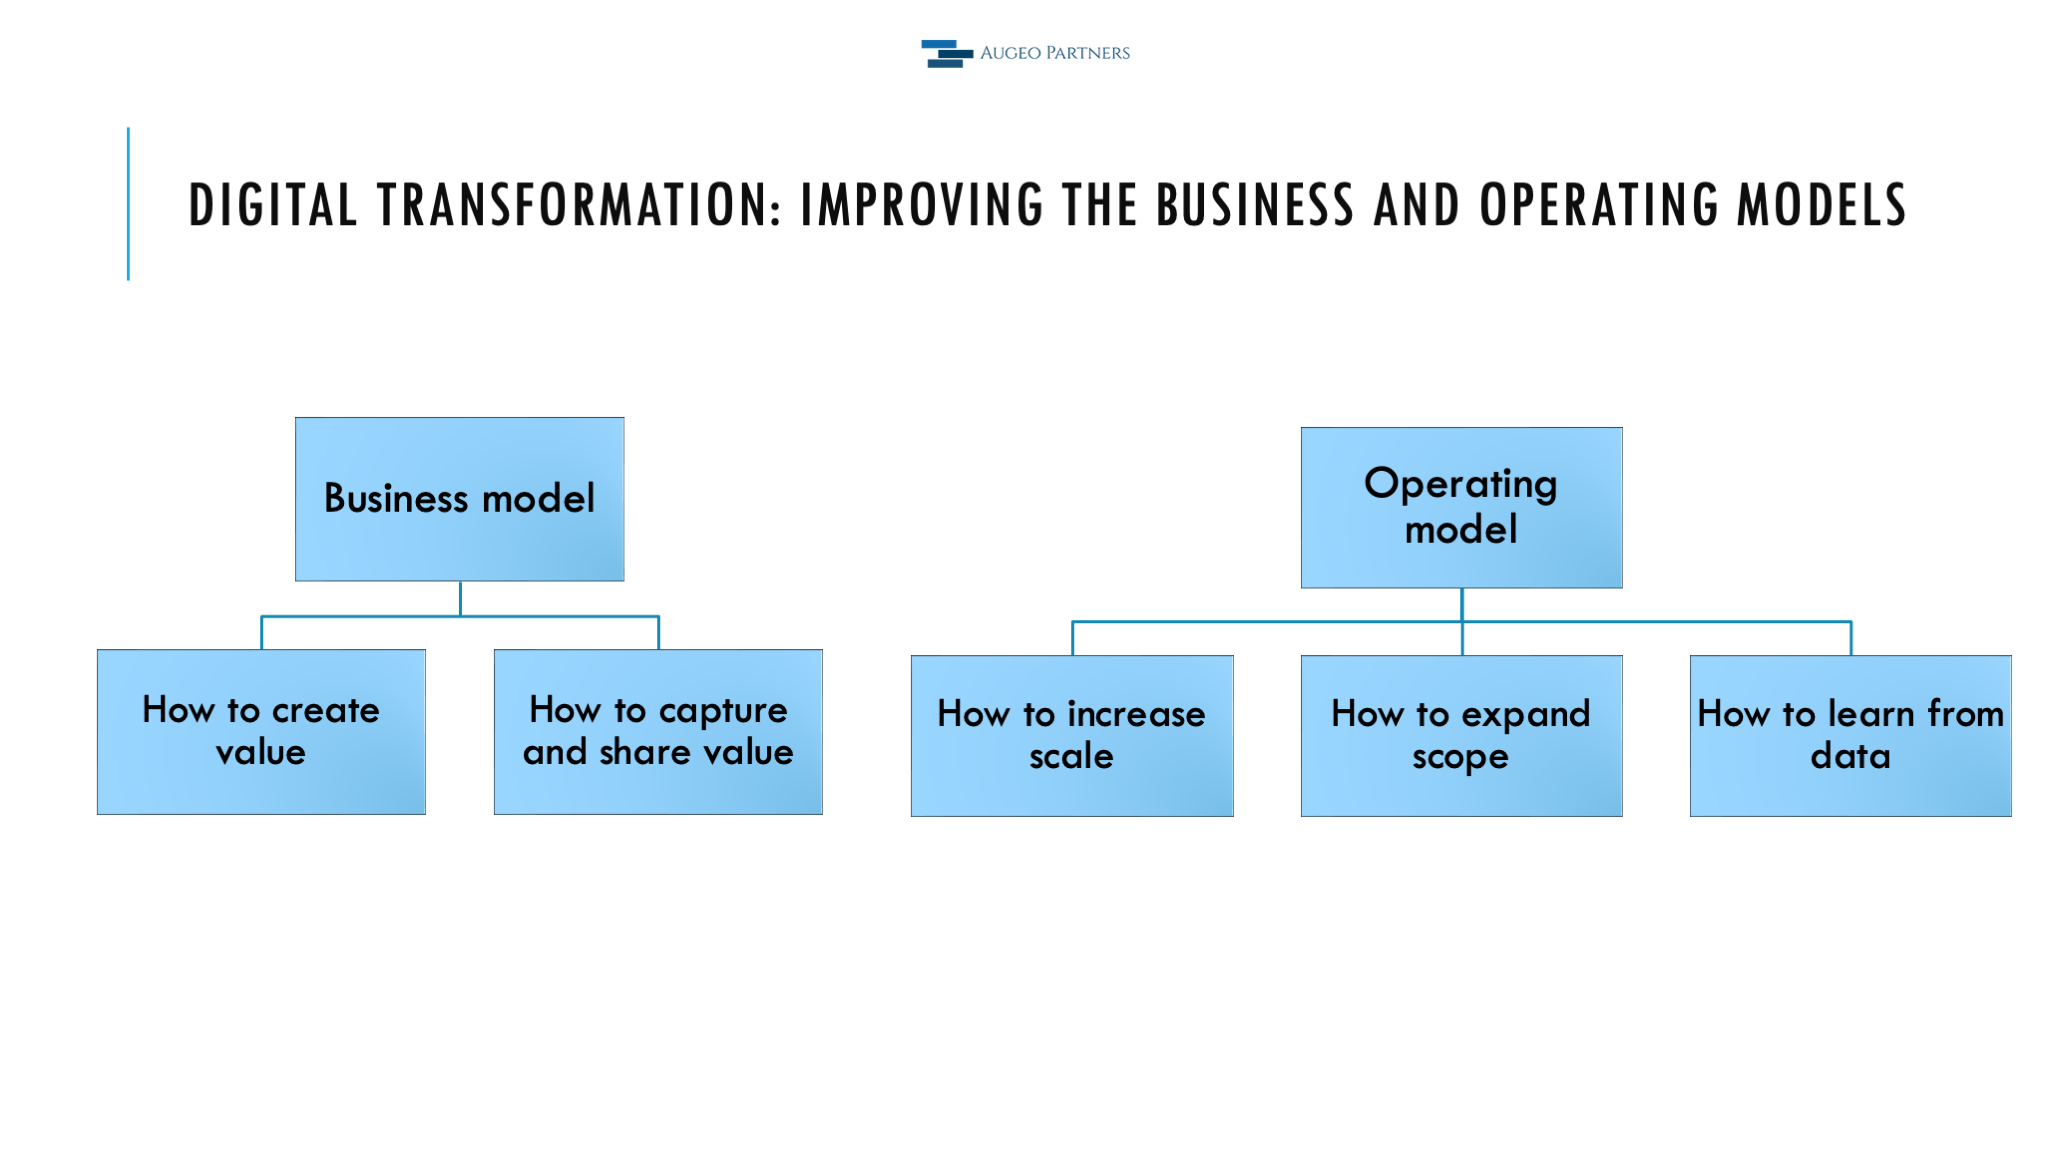
The modern business world, however, is vastly different. Companies now encounter increasingly heterogeneous markets. To maximize their profits, they must establish unique relationships with various customer segments and customize their product flows and service levels to align with varying needs and behaviors.
In this new context, the information generated by traditional ERP and financial systems is no longer sufficient for producing actionable insights, and this is a primary contributing factor to the persistence of embedded unprofitability in many companies.
In today's markets, the focus of value creation in many industries is moving from product innovation to customer relationship innovation, which revolves around account and supply chain management. To thrive in this environment, management teams require access to very granular data, which holds true for both product and service companies.
To effectively manage profitability in this environment, management teams require detailed information on real account profitability, product profitability, order profitability, and supply chain productivity. Only with this specific knowledge can they develop effective action plans to pull all the available profit levers, such as::
- Account selection.
- Demand management.
- Pricing and promotions.
- Product lifecycle management.
- Product flow management.
- Customer service management.
- Supplier management.
- Forecasting.
- Liquidity management.
Generating detailed profitability information used to be time-consuming and costly and, therefore, accessible only to large companies. However, with modern data warehouses and other data technologies, companies of any size can easily integrate and transform all of their transactional data, generating specific and actionable insights in a very cost-effective way.
In most small and mid-sized companies, an experienced solution manager working with a small cross-functional team that understands how the business operates, along with a couple of data and analytics engineers, can create an effective automated profit mapping solution in just a few months.
Eliminating embedded unprofitability is an achievable goal for most companies. It generally costs almost nothing and quickly generates large amounts of new profits and cash.
These projects usually break-even in 12 to 15 months, and over a three year period, the typical ROI at lower middle-market companies is 8x or more. Usually, the larger the company the higher is the ROI.
During a recent project with a small specialty distributor, we discovered that 36% of the invoices had a negative gross profit over the last twelve months. If 50% of the "bad" business had been eliminated, the company's reported gross profit would have improved by 22.4%. Furthermore, if the remaining 50% of "bad" business had been converted into "good" business with an average gross profit margin of ten percent, the company's reported gross profit would have improved by more than fifty percent.
On the other hand, failing to eliminate the sources of embedded unprofitability will have significant negative consequences for every company:
- Reported profits will be much lower, often half of what they could be.
- The best customers will generally receive only average service, which raises the critical risk of competitors stealing the profitable parts of the business by offering better service.
- The company will lose the opportunity to shift resources to the highest-payoff activities.
The following article briefly outlines the methodology and technologies accessible to most mid-sized companies for creating a straightforward yet efficient profit-mapping data solution to help identify the root causes of embedded unprofitability, and pinpoint the high-profit business that deserves focus.
The past 18 to 24 months have posed challenges for many companies, making it essential to equip management teams with the necessary tools to begin hunting for profit within their existing businesses.
At most middle-market companies, developing an effective profit mapping system should be a top 3 priority for 2025.
Starting the Hunt for Profits
Questions about which customers, products, and services don't fit a company's business and operating model can quickly reveal whether a company manages profitability effectively and whether the key managers' actions are aligned.
To quickly assess their companies' situation, CEOs should try an easy exercise: Call for a thirty-minute meeting with the managers who runs your company's key departments (sales, operations, supply chain, etc.) and ask each one to write down the names of five significant companies that shouldn't be customers, five products that shouldn't be carried, and five services that shouldn't be provided.
At most companies, the managers' lists will be either empty or include very different names. When that is the case, the company will have a few islands of high profitability but many unprofitable accounts, products, and transactions.
To overcome that situation, a company need to implement the following three essential steps:
- Develop a profit mapping model and database showing which accounts, products, and transactions fit its business and operating model and are profitable.
- Agree on the most appropriate set of profit levers (elements of a company's business and operating model) to pull to improve profitability, select and penetrate more "good" customers, and turn most "bad" customers into "good" customers.
- Implement a profit management process to help the organization align its day-to-day business activities with its business and operating model.
Developing a profit mapping model
A profit map is the core analytical tool management teams can employ to identify and fix the sources of embedded unprofitability at their companies, and identify the high-profit business they should pursue.
Profit is created or destroyed with each transaction, and generating actionable insights requires measuring profitability at the transaction level.
After measuring profitability at the transaction level, aggregating the data by any relevant dimension (accounts, products, locations, channels, orders, products by customer, etc.) in a few segments or profiles with similar characteristics and behavior will reveal which parts of the business fit the current business and operating models and are profitable, and which ones do not.
Therefore, the first step is to develop a model (a set of rules) to decide how to allocate variable, fixed, and ad hoc costs to each transaction. Essentially, you must develop the rules for creating an income statement for each order line.
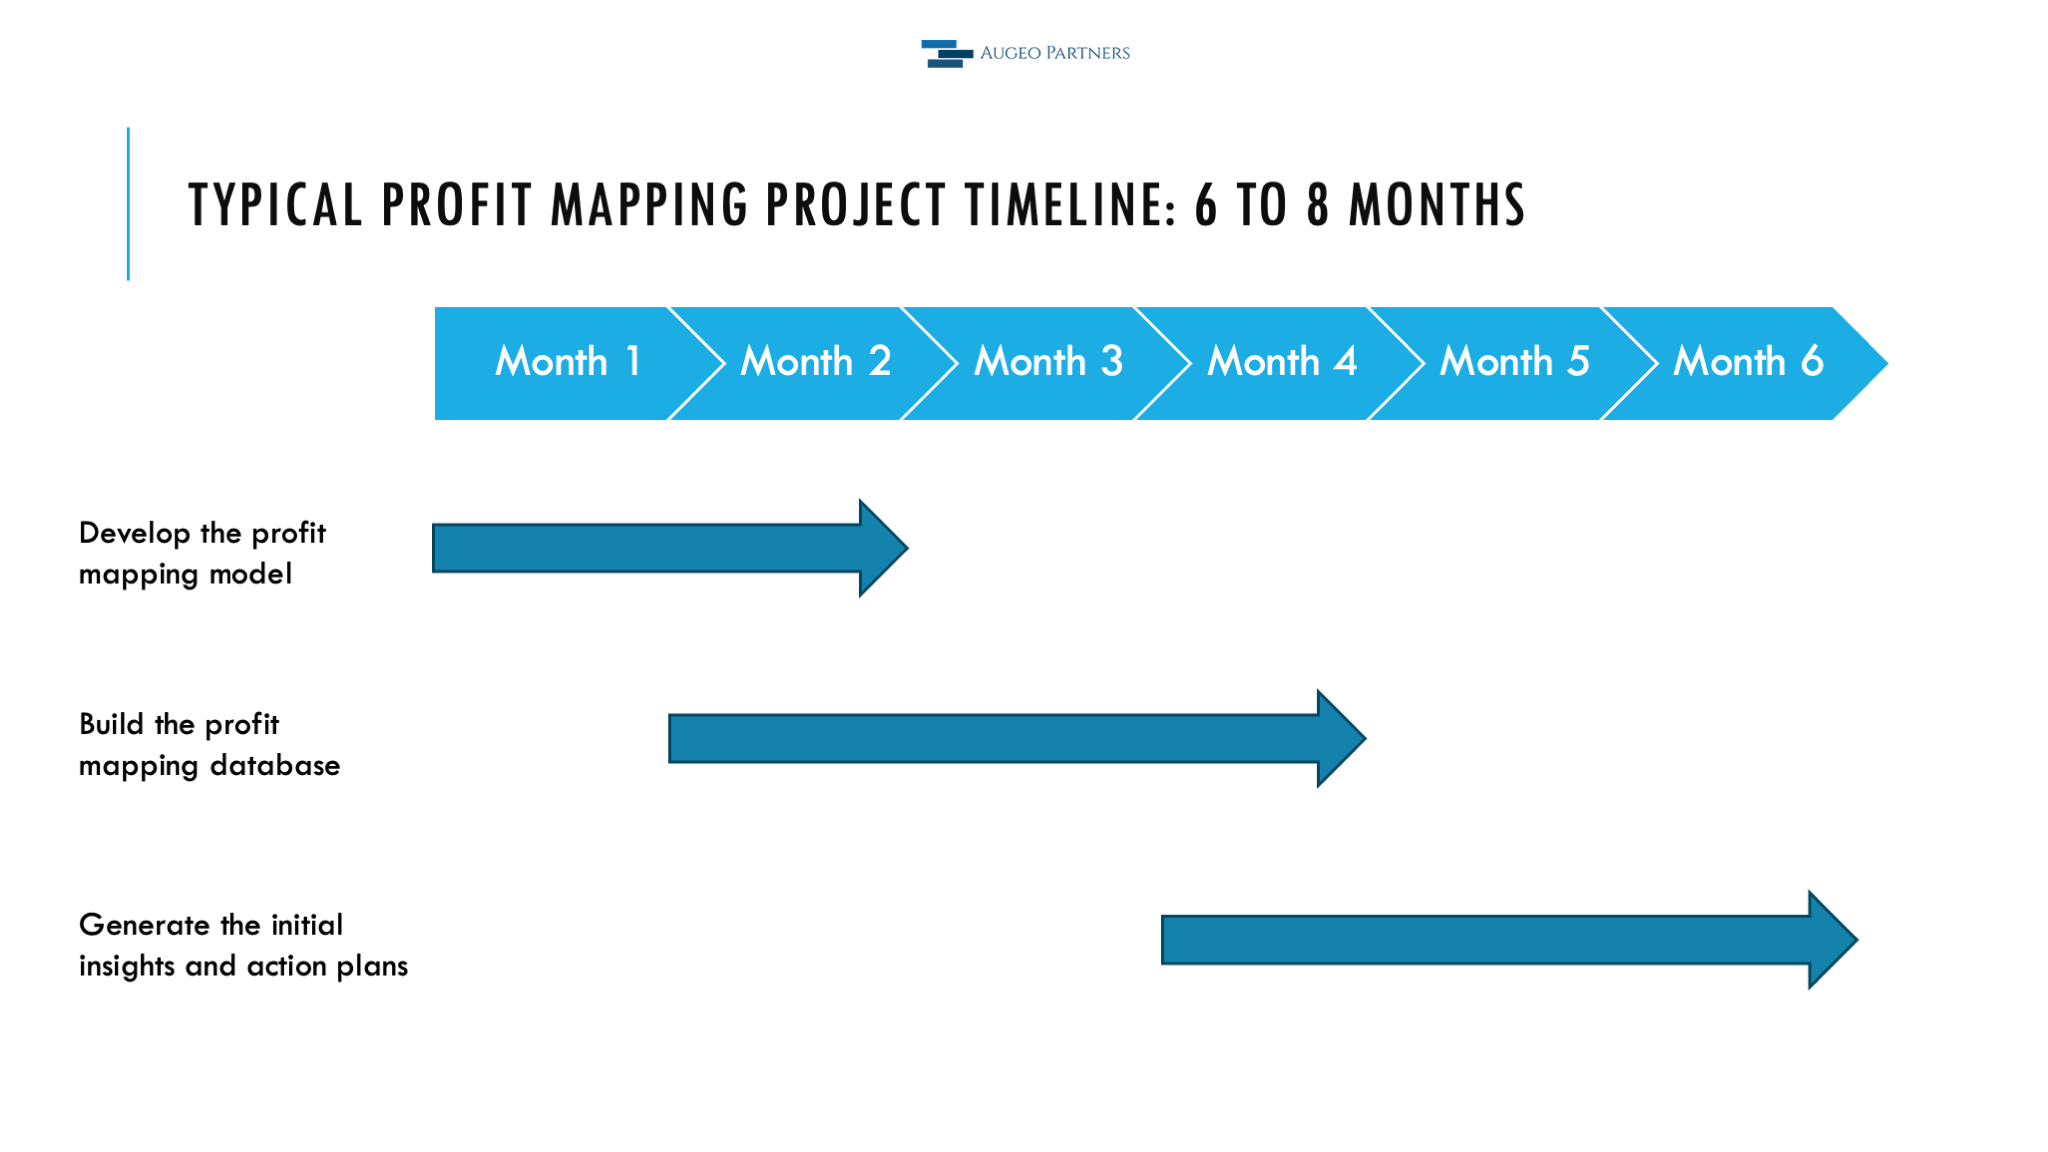
The key to successful profit mapping is to agree to analyze profitability with 70-80 percent accuracy using the best available knowledge and rules of thumb. Once a profitability picture emerges, it will make sense to improve the accuracy only when better information will change critical actions. At most middle-market companies, a small cross-functional team that understands how the business operates will typically be able to develop an initial set of common-sense cost functions (systematic ways of allocating costs to order lines) in six to eight weeks.
Once the conceptual profit mapping model is defined, the next step will be to build a profit mapping database and provide business users with an easy-to-use Business Intelligence (BI) tool to access the data and generate valuable insights.
Building a profit mapping database
In most companies, the data needed to create an estimated income statement for each order line is available within the company's transactional systems (e.g., ERP, financial system, CRM, etc.). However, this data is scattered across many different tables, and these systems lack the necessary functions to integrate and manipulate it as required. Customizing these applications is usually costly and not advisable.
The best way to build a profit mapping database is to use a data warehouse as a repository and single source of truth of all the company's structured and semi-structured data. The process to do it will require the following four steps:
- Selecting and setting up a data warehouse.
- Creating automated processes to periodically (e.g., daily) extract data from the company's transactional systems and load it into its data warehouse.
- Developing automated procedures (e.g., writing SQL code) to transform the data loaded into the data warehouse using data analytics best practices and the profit mapping model rules developed by the business team. Periodically, this code will run automatically and ultimately create and update a final dataset including all the relevant facts (e.g., revenue, gross profit, net profit) and dimensions (e.g., customer, product, location, channel, etc.) for each order line generated by the business.
- Connecting the profit mapping database to a BI tool to allow business users to easily access and analyze the data.
When J. Byrnes published his book in 2010, the aforementioned technologies were expensive and challenging to use. As a result, the methodology's applicability was limited. Analyses were restricted to a subset of all transactional data, could only be conducted periodically (e.g., once every 6 to 12 months), and were often cost-prohibitive for middle-market companies.
The data technologies that have emerged during the last fifteen years are significantly more affordable and easy to use, opening the opportunity to learn from data to companies of all sizes.
Nowadays, with a minum initial investment and a negligible monthly operating budget any middle-market company can have a profit mapping database that includes every transaction generated by the business and is updated daily or even hourly when appropriate.
Recommended data technology stack and project plan
Many affordable and easy-to-use data technologies are available in today's markets to transform transactional data into a profit mapping database. Companies already using a data warehouse and related technologies should stick to the tools they are familiar with. For middle-market companies that do not have a data technology infrastructure already in place, we recommend the following technology stack based on ease of use and affordability:
- Data Warehouse: In today's world, when used properly, a data warehouse is an essential technology for generating analytics insights and powering intelligent process automation. All the major cloud infrastructure providers offer viable solutions. For ease of use and breadth of functionalities, Snowflake is our platform of choice.
- Extract and Load Pipelines: Building engineering pipelines to periodically extract data from transactional systems and load it into a data warehouse used to be a manual, time-consuming, and expensive effort. However, new tools available in the market offer pre-built connectors to all the most common transactional systems (e.g., NetSuite, Microsoft Business Central, Salesforce, etc.). Using these tools, work that used to take weeks or months can be completed in just a few hours. The leaders in this space and our recommended tools are Fivetran and Airbyte.
- Transformations: This is a crucial and labor-intensive step. Using standard programming languages such as SQL or Python, data engineers will transform the transactional data and produce the final profit mapping database by applying data analytics best practices (e.g., data cleaning, denormalization, etc.) and the profit mapping model rules defined by the business team. To improve the efficiency and quality of this work, most data analytics teams, like us, use dbt Cloud.
- Business Intelligence: The market for Business Intelligence (BI) tools is highly developed and provides numerous options that are typically suitable for analyzing detailed profit data. When selecting a tool for our clients, we prioritize ease of use, affordability, and the range of features offered. Currently, our preferred tools include Metabase, Preset, and Amazon QuickSight. These tools enable us to create dashboards and reports for internal users quickly. Also, with a few weeks of additional work, they allow us to power a customer portal for sharing relevant transactional information (such as open and closed orders, unpaid and paid invoices, in progress deliveries, etc.) with our client's customers.
Estimated maintenance budget
After an initial modest investment that, as outlined above, typically has a quick and very high return on investment, the operating costs associated with maintaining a profitability management system like the one described above are very affordable.
Depending on the number of users and the usage intensity, the monthly costs of the data technology stack described above will typically range between $1,500 and $5,000 at a typical middle-market company. For example, a company storing about 500 GB of data into Snowflake, using 8 hours of Snowflake "small" compute capacity per day, and using Fivetran to extract and load half a million transactional records per month, will incur a monthly cost of about $1,200 for the above services. A Metabase pro licence for 10 user seats will add an additional $500 to the monthly budget.
Given that the profit mapping data solutions will have several workflows (i.e., small software programs) running daily to extract, load, and transform transactional data, the system will require a system administrator to monitor and manage the application. Instead of hiring a dedicated data engineer full-time, the best option for middle-market companies is often to outsource the service to a managed data analytic company.
When combining the expenses for the data tools and the professional services, the monthly total cost of ownership for a profit mapping data application at a middle-market company will typically range between $7,500 and $15,000.
Generating insights and action plans
Accessing a profit mapping database containing order line transactions, each with its revenue, gross profit, and net profit, along with a user-friendly business intelligence tool, will simplify and expedite the analysis of a company's profitability across various business dimensions such as accounts, products, channels, and locations.
With access to granular profit data, figuring out how to pragmatically and effectively change things to improve business profitability will become relatively straightforward.
The management team will be able to forecast the effects of adjusting the company's account and product mix, as well as other essential aspects of their operating model (such as order cycles, sales processes, service levels, pricing strategies, etc.), to convert most of the "bad" customers into "good" customers.
By having access to detailed profit data, management teams can pinpoint specific strategies for individual customer segments and products, rather than relying on generic approaches such as applying a 4% price increase across all products and customers or implementing a 5% cost reduction across all departments.
The ultimate goal is to identify a few high-reward actions that a company can promptly take to boost the profitability of its current business. A useful approach to arrange and rank actions in a standard yearly or six-month planning process is to categorize them into the following three groups:
- Actions to secure and retain the high-profit segments of the business.
- Actions aimed to acquire more of the high-profit business.
- Actions to improve the profitability of the marginal part of the business (aiming to change things like order patterns, order size, delivery requirements, pricing, etc.).
After working to improve the remaining unprofitable parts of the business, the management team can begin to phase out the parts they can't improve.
Institutionalizing Profitability Management
Effective profit management is essential for any company. The approach described above will promote teamwork and cultivate a greater cross-functional understanding of the business among the management team. By shifting the focus from short-term actions needed to simply "meet" the budget to strategic initiatives aimed at enhancing the profitability and sustainability of a company's business and operating models, most management teams will find it highly beneficial and engaging.
Profit management should be integrated into the regular quarterly business review and planning process. The profit improvement action plan should span four or five rolling quarters. Each quarter, the management team should evaluate the progress made on previously defined actions and determine the best way to update the plan based on insights from the most recent profit mapping data. Over a few quarters, the cumulative impact of this approach on business profitability will be remarkable.
While proven playbooks and modern technologies are essential, companies are about people and resistance to change should be expected as is always typical with any new initiative.
Management effectiveness will be crucial to maximizing business profitability and company performance. Without top management leadership and an effective management team, all profit initiatives will fall short. Effective change management will be essential for ultimate success.
Studies show that in most organizations, two out of three change initiatives fail. The more things change, the more they stay the same. Harvard Business Review.
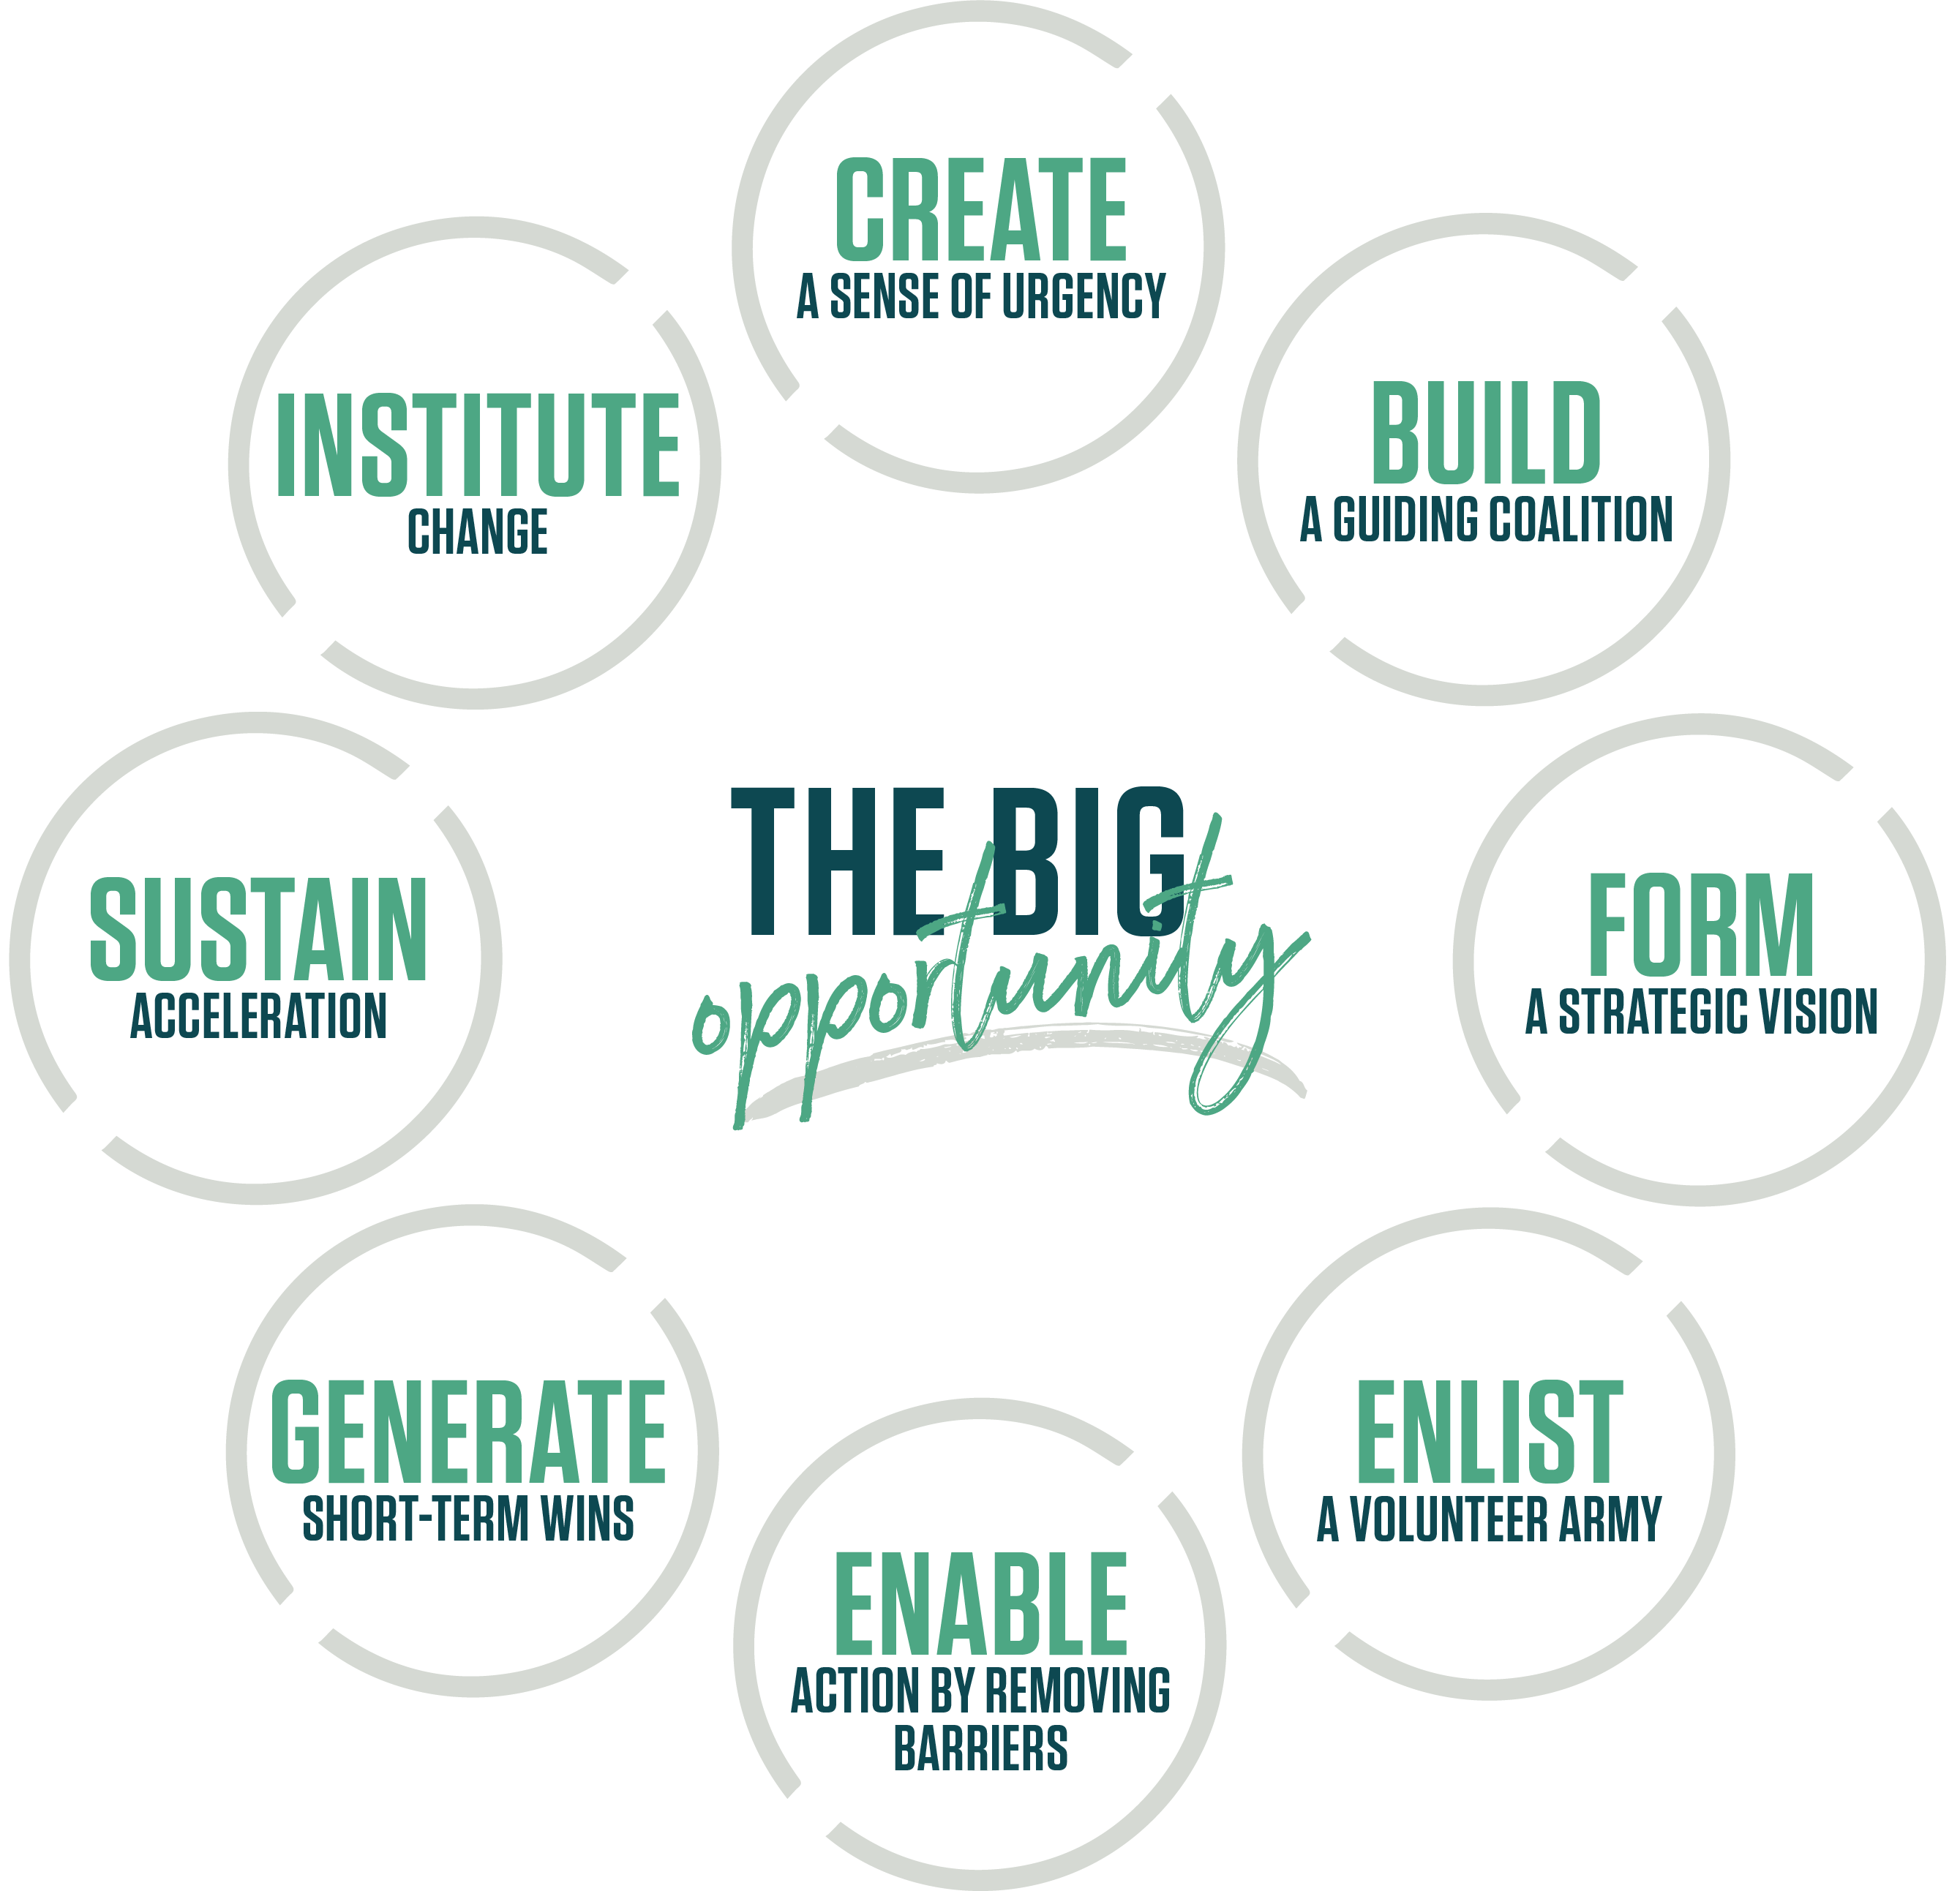
A recent search on Amazon.com for books on change management returned more than 50,000 titles. However, in our opinion, Kotter's original framework on successfully leading change still provides the best way to define a pragmatic and effective approach to producing lasting change.
Augeo Partners is a boutique firm of senior business and technology leaders with a significant track record in accelerating growth and profitability through strategy, process design, digital technologies, and change management. We partner with management teams and private equity investors to accelerate value creation through a set of proven strategies and playbooks. The time to start hunting for greater profit within your existing business is now, and Augeo Partners can help.